

Public status pages
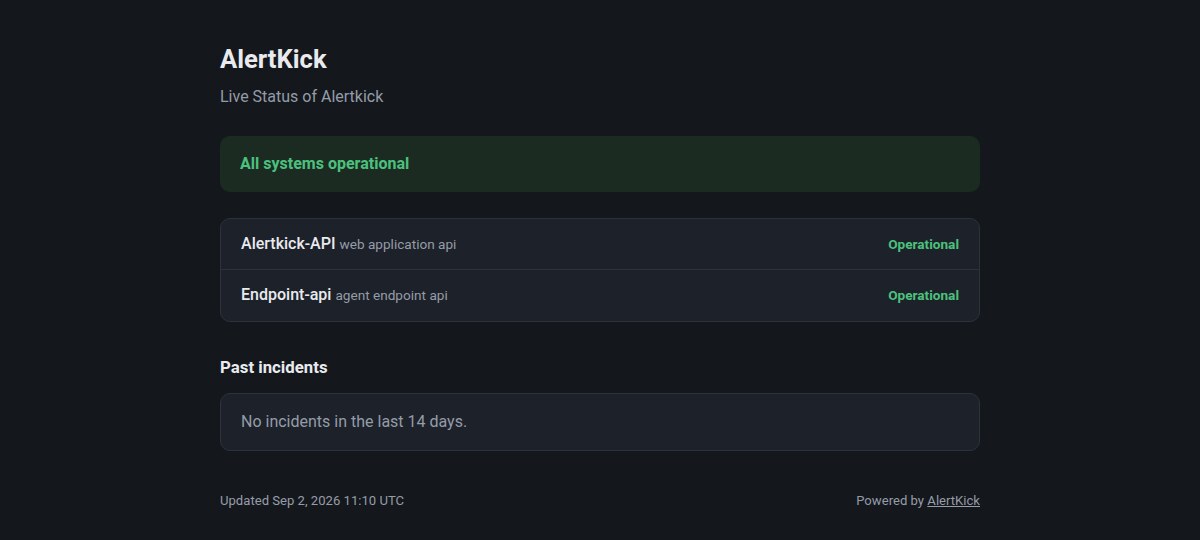
Every workspace includes a public status page, served at
status.alertkick.com/<your-subdomain> - the same subdomain you sign in
with. It is off by default. When you enable it, the page shows a banner
(“All systems operational”, “Some systems are experiencing issues”, “Major
outage”), a row per component, any incidents you have published, and a
14-day incident history.
The important property: component states are computed from your monitors, not typed in by whoever remembers the page exists. A monitor going critical flips its component to a major outage; recovery flips it back. During an incident the page keeps itself honest while you work.
Enable the page
Section titled “Enable the page”Status, then Status Pages lists your pages - every workspace starts with one default page. Open it, flip Status page enabled - the public URL appears next to the switch. Set a title (“Acme status”) and an optional description; both render at the top of the public page. The page is public the moment you enable it, so add your components first.
Multiple status pages
Section titled “Multiple status pages”One page is often not enough: a page per product, a page for a big customer, an internal-tooling page. Add Status Page creates an additional page (up to 10 per workspace). Additional pages are served at
status.alertkick.com/<your-subdomain>/<page-id>where the page id is a short random identifier AlertKick generates - it is
not guessable from your subdomain, so a page you share only with one
customer stays effectively unlisted until you publish the URL. Each page
has its own components, its own enable switch, and its own custom domain.
The default page keeps the bare /<your-subdomain> address. Additional
pages can be deleted from their settings; the default page can only be
disabled.
Components
Section titled “Components”Components are the rows on the page: “API”, “Dashboard”, “Background jobs”. Each has a name, an optional one-line description, and the things that prove it works:
- Linked monitors - any uptime, TCP, DNS, or other monitors. The component takes the worst state among them.
- Linked service - an infrastructure service. All of the service’s monitors count, and so do published incidents that affect the service.
Order the rows with the up and down arrows; the page renders them in the order you set.
How states are computed
Section titled “How states are computed”| Signal | Component state |
|---|---|
| A linked monitor is critical | Major outage |
| A linked monitor is warning | Degraded |
| Published incident on the linked service, severity P0 | Major outage |
| Published incident on the linked service, below P0 | Degraded |
| Monitor paused or disabled | Ignored |
Paused monitors contributing nothing is deliberate: pausing a check for planned work must not show your customers an outage. The banner takes the worst state across all components, and an open published incident keeps the banner off green even when every monitor has already recovered.
Uptime history
Section titled “Uptime history”Every component carries a 90-day strip, one bar per day, and an uptime figure for the window. The strip is rebuilt from your monitors’ status history on every render, so it works from day one: any monitor that has ever gone critical or warning already has its days painted.
| Bar colour | Meaning |
|---|---|
| Green | Operational all day |
| Amber | Degraded for part of the day (a linked monitor was warning, or a published incident below P0 was open) |
| Red | Outage for part of the day (a linked monitor was critical, or a published P0 incident was open) |
| Grey | No data - before the component’s oldest monitor existed, or nothing is linked yet |
Hover a bar for the day and how long it spent degraded or down. The uptime figure counts only outage time against the component: a slow check is not a down service. The page header shows the average across every component that has data.
Published incidents paint the strip too, mapped onto the services they affected, so a component that is proven by an incident rather than a monitor still gets its history.
Incident history covers the same 90 days, grouped by day. The last two weeks are shown in full; anything older sits under an “Earlier incidents” toggle so the page stays short.
At the foot of the page, Browse by day is a calendar of the same 90 days, each day coloured by the worst state across all components. Pick a day to see every component’s state for that day, how long it was degraded or down, and the incidents that were open. The calendar and the day panel are plain links, so a chosen day has its own address you can share.
Publish an incident
Section titled “Publish an incident”Incidents are private until you say otherwise. On the incident detail page, flip Show on public status page, then give it a public title - the internal title stays internal, so “prod-db-eu-1 replica lag after failover” can go out as “Delayed dashboard data”.
Each update you post to the incident has its own public checkbox. Working notes stay private; the updates you mark public appear on the page under the incident, newest first. Resolved incidents stay in the incident history for 90 days.
With more than one status page, a Show on these pages picker appears next to the switch: tick the pages this incident belongs on. Incidents published before you added extra pages stay on the default page.
Auto-publish
Section titled “Auto-publish”The settings page has an Auto-publish incidents section with a severity floor (P0 only, or P1 and above). It is marked coming soon: the setting is saved now and will take effect when incident automation ships. Until then, publishing is the manual switch above.
Custom domains
Section titled “Custom domains”Custom domains and the logo below are included with paid plans (and the full-access trial). On the Free plan the settings page shows where they sit instead of the controls.
The page can live on your own hostname, for example status.acme.com.
In Status, then Status Pages, add the hostname under Custom
domain, then create the CNAME record the page shows - it points your
hostname at AlertKick’s serving infrastructure. Ownership is validated
through the CNAME itself and the TLS certificate is issued and renewed
automatically: no TXT records to add, nothing to renew on your side.
The domain shows as pending until the record resolves, then flips to
active - Check status polls on demand, and validation normally
completes within a few minutes of the CNAME going live. A domain attaches
to one page at a time, and each page carries at most one domain - so a
workspace with a page per product can give each product its own status
hostname. Removing a domain frees it immediately. Your page stays
reachable at its status.alertkick.com address either way.
Status, then Status Pages, open a page and use the Logo card to upload a PNG, JPEG, WebP or SVG up to 96KB. It appears in the page header next to the title, 32px tall, so a horizontal mark works best. The image is stored with the page and served inline: the public page never loads it from your site, so it still shows during an outage of your own infrastructure. Remove it from the same card. Paid plans only, same as custom domains.
Serving details
Section titled “Serving details”The page is rendered by a separate read-only service and cached at the edge for 60 seconds, with a stale-if-error window - it stays up even if the origin has a bad day, which is the whole point of a status page. Changes you make appear within about a minute. The output is plain server-rendered HTML with no cookies and no trackers; the only script on the page is the day picker, which swaps the “Browse by day” block in place instead of reloading, and every day is still a plain URL that works with JavaScript off. It respects dark mode and loads fast on a phone.