

Monitor types
The agent watches your servers from the inside. Monitors watch them from the outside, the way your users see them: point one at a URL, a port, or a hostname and be told the moment it stops responding, slows down, or is about to expire. Every type shares one workflow - pick a target, set the interval, choose who gets alerted - and monitors are included on every plan.
This page is the reference. For the step-by-step of creating your first monitor, see Monitor a website.
Monitors check your endpoints on a schedule and alert through your escalation chains the moment something breaks
The types
Section titled “The types”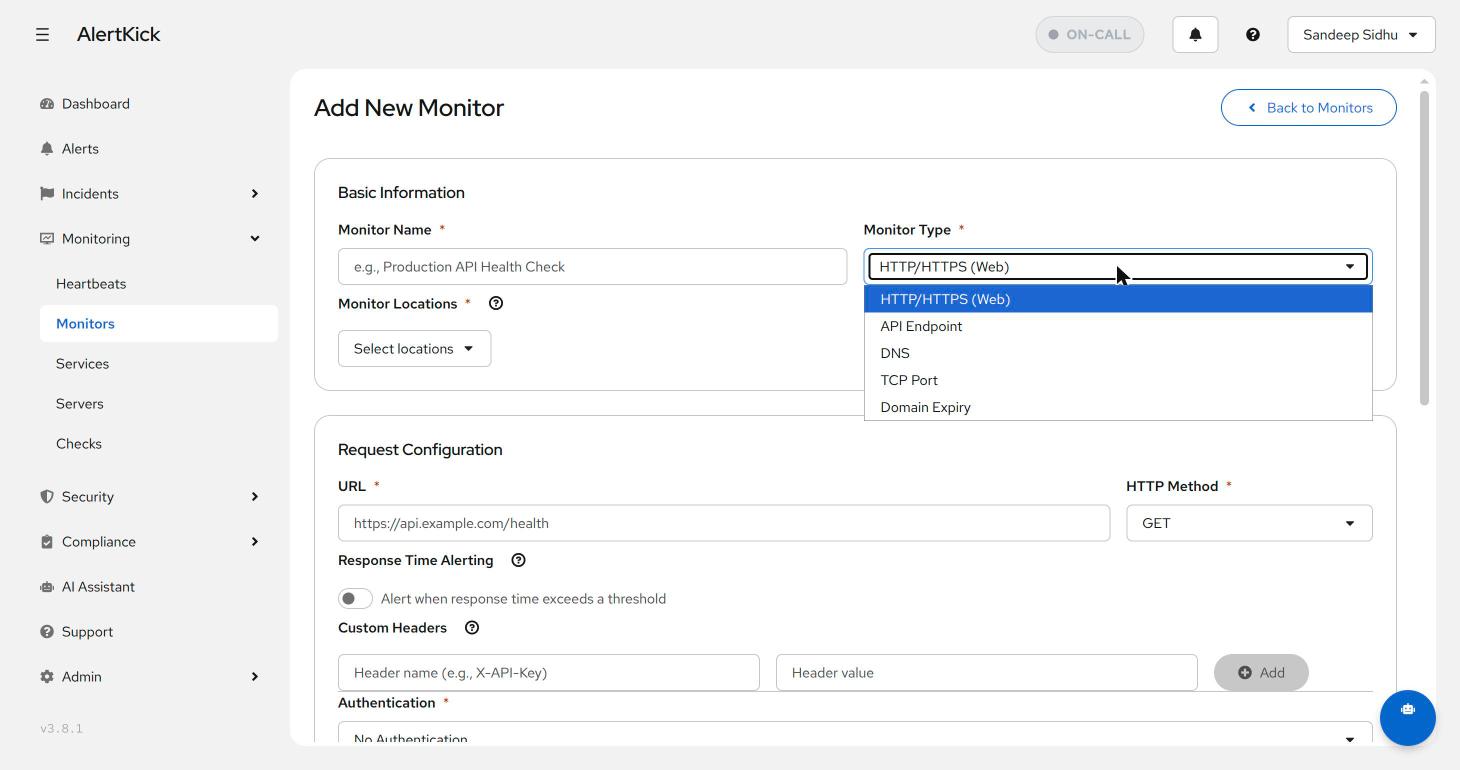
Type (monitor_type) | Target (url) | Passes when |
|---|---|---|
HTTP/HTTPS (http) | Full URL | The response carries the expected status code, and the body contains the expected string if one is set |
API Endpoint (api) | Full URL | Same check as http; the label exists so API assertions are easy to spot in the list |
DNS (dns) | Hostname | The record resolves, and the answer contains the expected value if one is set |
TCP Port (tcp) | Hostname or IP | A TCP connection to the port opens within the timeout |
Domain Expiry (domain) | Registrable domain | The registration expiry date is further away than the lead time |
TLS certificate expiry is not a separate type. It is the
ssl_cert_monitoring setting on an HTTP/HTTPS monitor, offered
automatically for https:// URLs. Details for certificates and domains
are on Domain and SSL certificate expiry.
HTTP/HTTPS and API Endpoint
Section titled “HTTP/HTTPS and API Endpoint”- Method -
GET,POST,PUT,PATCH,DELETE,HEAD, orOPTIONS, with an optional request body and custom headers. - Authentication - basic (username and password) or bearer token,
sent as the
Authorizationheader. - Expected status code - required; a login-walled page that
redirects is healthy when it returns
302, so expect that rather than200. - Expected response contains - the check fails unless the body contains this string. Only the first 10 KB of the body is inspected.
- Up to 10 redirects are followed. Every check records the response time, which feeds the monitor’s chart and the response-time threshold below.
- Record type (
dns_record_type) -A,AAAA,CNAME,MX,TXT, orNS. - Expected value (
expected_dns_host) - optional. When set, the check fails if the answer no longer contains it, so a hijacked or misconfigured zone surfaces as an alert. Without it, only a failed or empty resolution fails the check. - Answers are tracked per check location either way, and a change in the resolved answer is recorded as a monitor event.
TCP Port
Section titled “TCP Port”- Port (
tcp_port) - required, 1 to 65535.http://,https://, andtcp://prefixes on the host are stripped. - Suited to anything that speaks TCP but not HTTP: databases, mail servers, message brokers, your own services.
Domain Expiry
Section titled “Domain Expiry”- Lead time (
domain_expiry_alert_days) - 1 to 365 days, default 30. - Looks up the domain’s RDAP record and also records registrar, transfer lock, nameservers, and mail posture (MX, SPF, DMARC). A daily interval is enough; registry data changes at most daily.
Email deliverability
Section titled “Email deliverability”The Email (SPF / DMARC / Blocklists) type checks a sending domain’s MX, SPF, DMARC, DKIM, MTA-STS, and TLS-RPT records and five DNS blocklists, graded out of 100, and alerts on the failures that get mail rejected. It has its own page: Email deliverability monitoring.
MCP server
Section titled “MCP server”The MCP server type connects to a remote MCP endpoint, lists its tools, and alerts when the handshake breaks, the OAuth discovery chain breaks, or the tool list drifts from the baseline a person approved. It never calls a tool. It has its own page: MCP server monitoring.
Settings shared by every type
Section titled “Settings shared by every type”| Field | Default | Notes |
|---|---|---|
check_interval_seconds | 60 in the web form, 300 from MCP | Free plan floor 300 s; Professional and Business 60 s. Values below the plan floor are clamped up, not rejected |
timeout_seconds | 30 | 1 to 300 |
failure_threshold | 3 | Consecutive failed results before the monitor turns Critical and alerts |
locations | One location | Which poller locations run the check |
escalation_policy_uuid | Account default policy | Who gets told |
response_time_alert_ms | Off | HTTP/API only; see below |
How a check becomes an alert
Section titled “How a check becomes an alert”Each selected location runs its own check on the interval, and every result feeds one counter on the monitor:
- A failed result increments
consecutive_failures. Until the threshold is reached the monitor shows Warning and no alert is raised - sub-threshold blips on a flaky target would otherwise flood the feed. - When
consecutive_failuresreachesfailure_threshold, the monitor turns Critical, a status-change event is written, and an alert is created and routed through the escalation policy. - Further failing results re-trigger the same open alert rather than paging again; the trigger count on the alert climbs.
- A successful result from any location resets the counter. If the monitor was Critical, it returns to OK and the alert auto-resolves.
Because the counter is shared across locations, three failures in a row from one location and one failure from each of three locations both trip the default threshold. Choosing more locations gives faster and broader coverage, not a vote. Free plans include one regional location; other locations are visible in the form but locked.
Other statuses: Pending for a monitor that has not been checked yet, Paused when disabled. Pausing stops the checks and no alerts fire until it is resumed. Each monitor also carries a rolling health percentage (successful checks over total checks) shown in the list view.
Response-time thresholds
Section titled “Response-time thresholds”A site that answers 200 in eight seconds is technically up and, by
default, alerts nobody. Set response_time_alert_ms on an HTTP or API
monitor to catch that:
- Only successful checks count. A check slower than the threshold adds
to a separate
consecutive_slow_checksstreak; a failed check clears the streak, because the down alert already owns that case. - When the streak reaches
failure_threshold, a slow alert is raised - distinct from the down alert - and it resolves once the response time recovers. The monitor status stays OK throughout. - The first crossing writes an event of the form “Response time 8200ms exceeded threshold 2000ms for 3 consecutive checks”.
Most outages announce themselves as a slowdown first. For server-side metric alerting (CPU, memory, disk), see Server monitoring.
Check locations
Section titled “Check locations”Checks run from AlertKick’s poller locations, and results are labelled by location so the response-time chart shows one line per vantage point. To monitor internal dashboards, admin panels, and private APIs, run a poller inside your own network - it appears as a customer location in the same picker. See On-premise pollers.
Escalation policy binding
Section titled “Escalation policy binding”Every monitor binds an escalation policy; if you do not choose one, the account’s default policy applies. The policy, not the monitor, decides severity treatment, channels, quiet hours, and who is on call. The create form previews the bound policy’s steps so you can see who will be woken before you save:
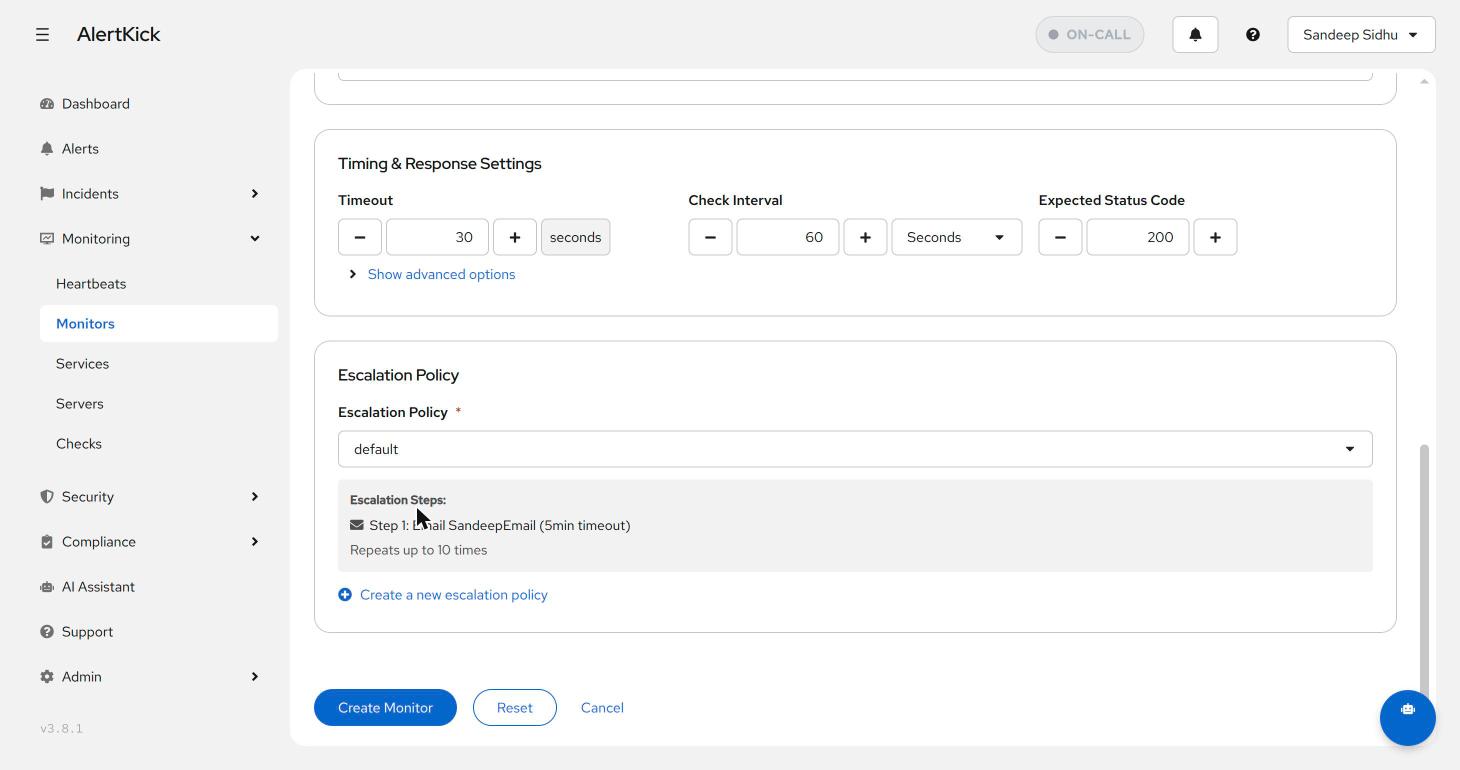
See Escalation policies and Alerts.
Creating monitors outside the web form
Section titled “Creating monitors outside the web form”MCP tools for AI assistants (see AI assistants):
| Tool | Notes |
|---|---|
create_https_monitor | URL, expected status, body match, certificate monitoring, response-time threshold |
create_dns_monitor | hostname, record_type, optional expected_value |
create_tcp_monitor | host, port |
create_domain_expiry_monitor | domain, domain_expiry_alert_days; interval fixed at daily |
create_mail_monitor | domain, optional require_dmarc_policy |
create_mcp_monitor | url, optional transport, auth_mode, headers, drift_policy, expected_tools, max_tools |
create_monitor | Generic escape hatch accepting any monitor_type and field |
list_monitors, get_monitor, pause_monitor, resume_monitor, delete_monitor | Read and lifecycle |
The MCP tools do not expose HTTP headers, auth, or the escalation policy (create_mcp_monitor takes headers for the MCP
server it watches); those default as described above and can be edited afterwards in the dashboard.
REST API - POST /api/v1/monitors/create with display_name,
monitor_type, and url required; everything else has the defaults
in this page. Update, pause, resume, and delete are under the same
prefix. See the API reference.
Mobile app - HTTP, DNS, and domain-expiry monitors can be created from the Infra tab. See Mobile app.
Related
Section titled “Related”- Heartbeats - the inverse check, for cron jobs and batch work that should call in.
- Domain and SSL certificate expiry