Security events
Read the eBPF security event stream - filtering by priority and AI verdict, understanding detection rules and compliance tags, and drilling into a single event's analysis.
Updated
Once the agent is on a host, its eBPF sensors report security-relevant activity - process executions, file access, network connections, privilege changes - and the detection rules turn that firehose into events. This guide is a tour of where those events land and how to read them.
The event stream
Security, then Events. The histogram shows volume over the selected window; the table below is the stream itself:
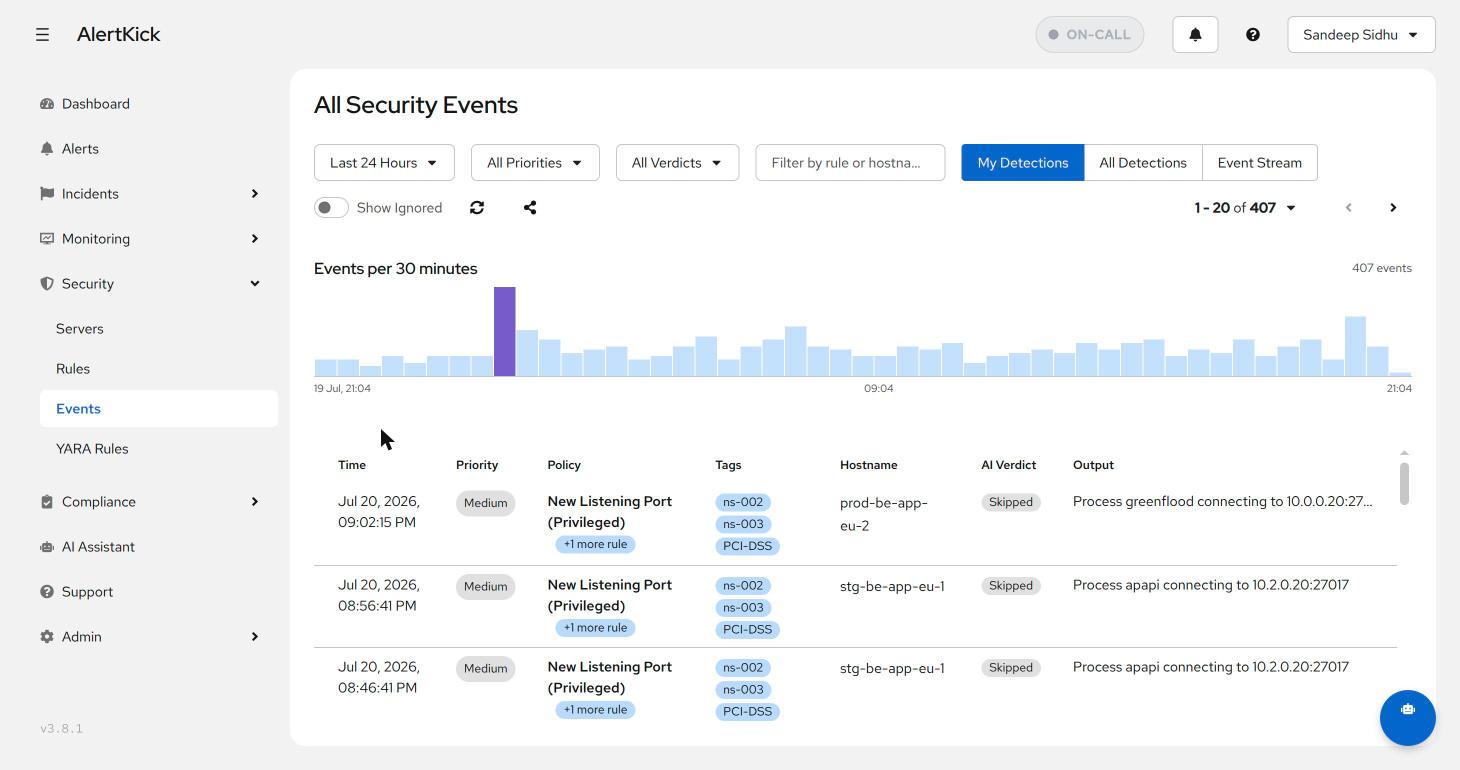
Each row carries:
- Priority - the rule’s severity (info through critical).
- Policy - which detection fired (“New Listening Port (Privileged)”).
- Tags - rule IDs and the compliance frameworks the event is evidence for (PCI-DSS, SOX). These flow through to MITRE ATT&CK mapping and the compliance reports.
- AI Verdict - what the triage layer concluded: malicious, suspicious, policy violation, benign, or noise. Low-stakes events are skipped rather than burning analysis on them.
- Output - the one-line summary with the concrete details (process, target, port).
The filter bar cuts the stream by time window, priority, verdict, or free-text rule and hostname search. My Detections shows events from your enabled rule set; All Detections includes everything the agent observed; Event Stream is the raw live tail.
A practical reading order for a normal week: verdict filter to malicious and suspicious first (should be empty or short), then high priority regardless of verdict, then skim the histogram for volume anomalies - a new spike of even benign events usually means a deploy changed behaviour somewhere.
Drilling into one event
Click a row and the detail panel opens with three tabs. Overview is the structured fields, Raw Data is the full captured event, and AI Analysis is the triage reasoning - what the model looked at (process ancestry, connection target, timing) and why it reached its verdict:
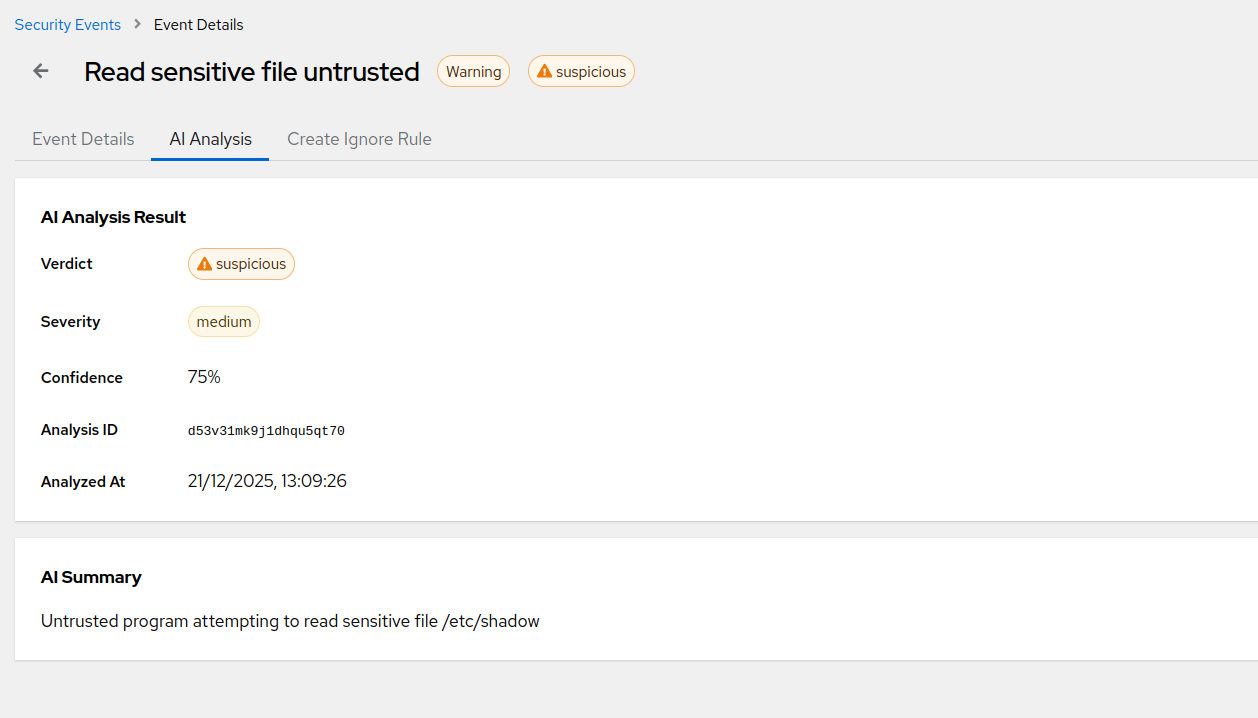
When the verdict is wrong for your environment (“that scanner is ours”), use the ignore options on the event to suppress that specific pattern rather than disabling the whole rule - the rule keeps protecting everything else.
The rules behind the events
Security, then Rules lists every alert policy grouped by area, with per-rule enable toggles, severity, and the frameworks each rule contributes evidence to. Toggling a compliance framework at the top enables every rule that framework needs:
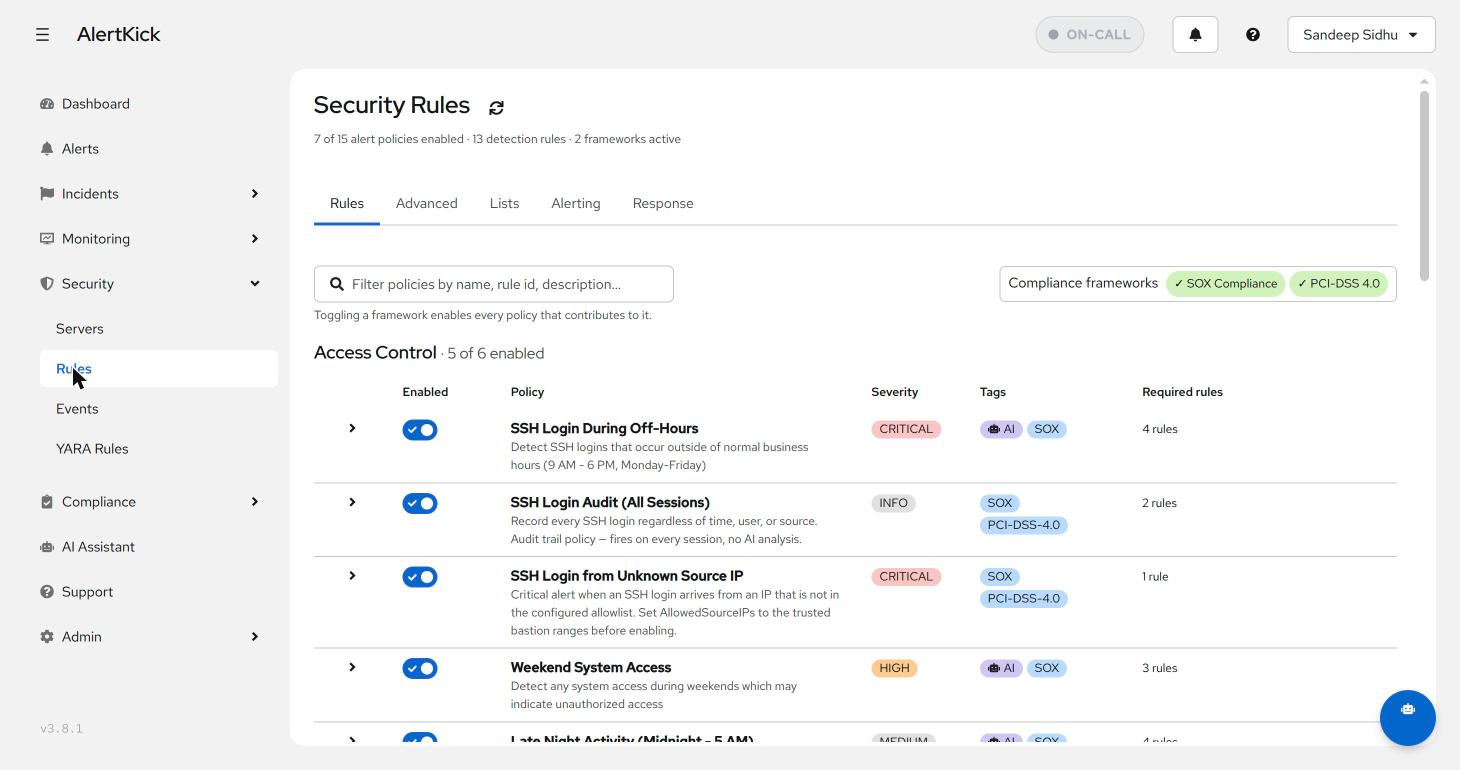
Rules tagged AI route through triage before alerting; audit-trail rules (like “SSH Login Audit”) record every occurrence without analysis, because their job is evidence, not judgement. The Alerting tab controls which priorities page a human and which just land in the stream - see escalation policies for where they go.
From event to alert
Events and alerts are deliberately different things. Thousands of events a day are normal on a busy host; the alert and event linkage means only events that survive triage with a concerning verdict, on rules you’ve marked alerting, become alerts - deduped per host and rule so a repeating detection is one incident, not four hundred pages.
Next steps
- The MITRE ATT&CK overview explains the tactic and technique tags on every event.
- Tune noisy-but-legitimate patterns with per-event ignore rules before reaching for the rule toggle.
Try it on your own infrastructure
Everything in this guide works on the free plan or the 30-day money-back paid tiers - uptime monitors, heartbeats, escalations and on-call, plus the agent for metrics and eBPF security. Setup takes minutes, not sprints.