Working with alerts
The alert lifecycle from triggered to resolved - reading the alerts list, acknowledging and escalating, repeat counts, AI triage verdicts, and how every alert links back to the events or checks that raised it.
Updated
An alert is AlertKick’s unit of “a human may need to act”: a monitor failed, a heartbeat went silent, a security rule fired, or a metric crossed a threshold. Everything about the Alerts page is built around one question - has someone taken ownership of this yet?
The alerts list
Alerts in the sidebar. The default filter shows what needs attention: triggered and acknowledged alerts, newest first:
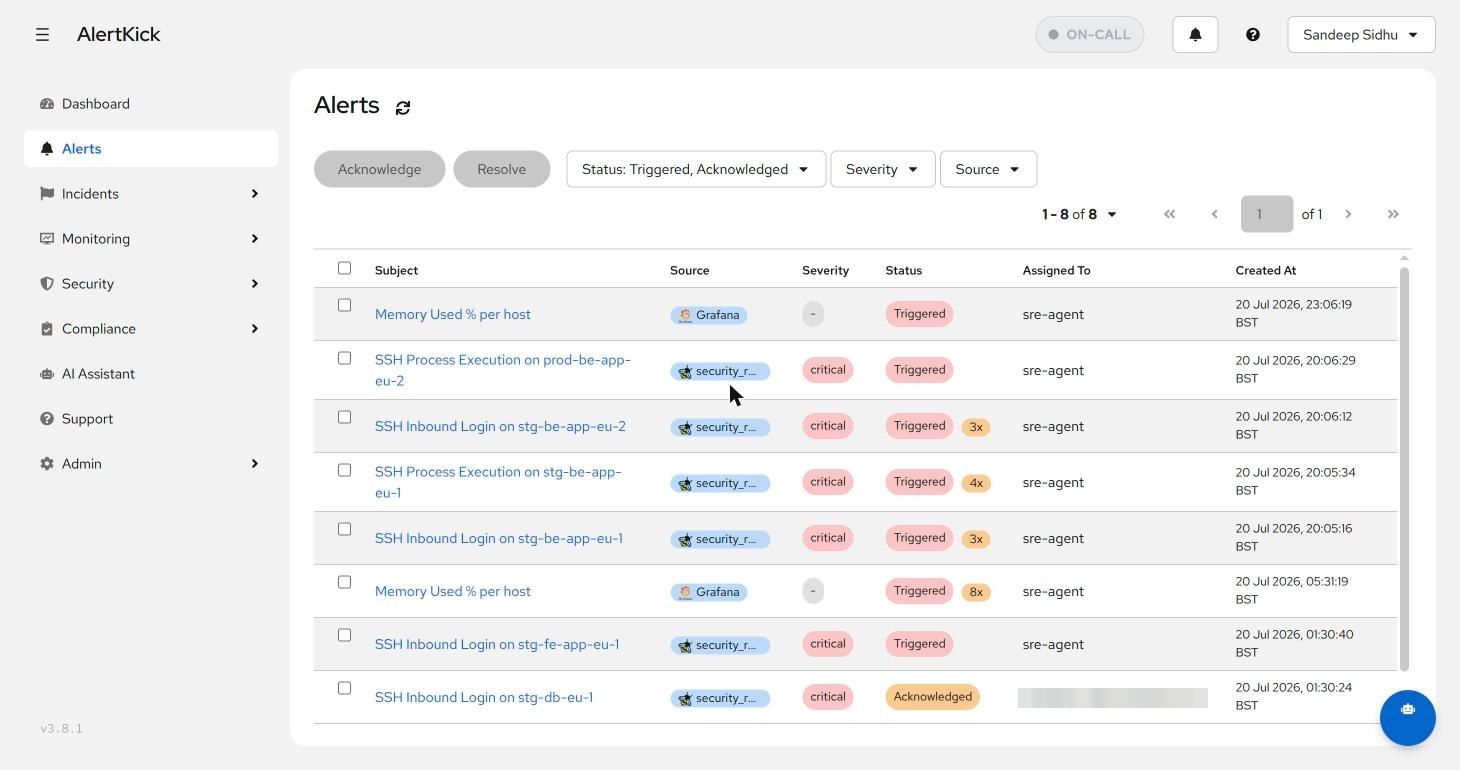
The columns that drive triage:
- Source - what kind of thing raised it: a security rule, a monitor, a heartbeat, or an external integration (Grafana webhooks land here too, so one page covers alerts you didn’t even generate in AlertKick).
- Severity - carried from the rule or monitor that fired.
- Status -
Triggered(nobody owns it yet),Acknowledged(someone is on it),Resolved. The small repeat count badge (3x,8x) means the same condition fired again while the alert was open - deduplication keeps it as one alert per host and rule instead of a page storm, and the count tells you it’s still happening. - Assigned To - who owns it. When the AI on-call assistant picks an
alert up for triage you’ll see it assigned to
sre-agent; a human acknowledging takes it over.
The checkboxes plus the Acknowledge and Resolve buttons at the top handle bulk operations - useful after a maintenance window generates a batch of alerts you’ve already dealt with.
Anatomy of one alert
Click any row for the detail view:
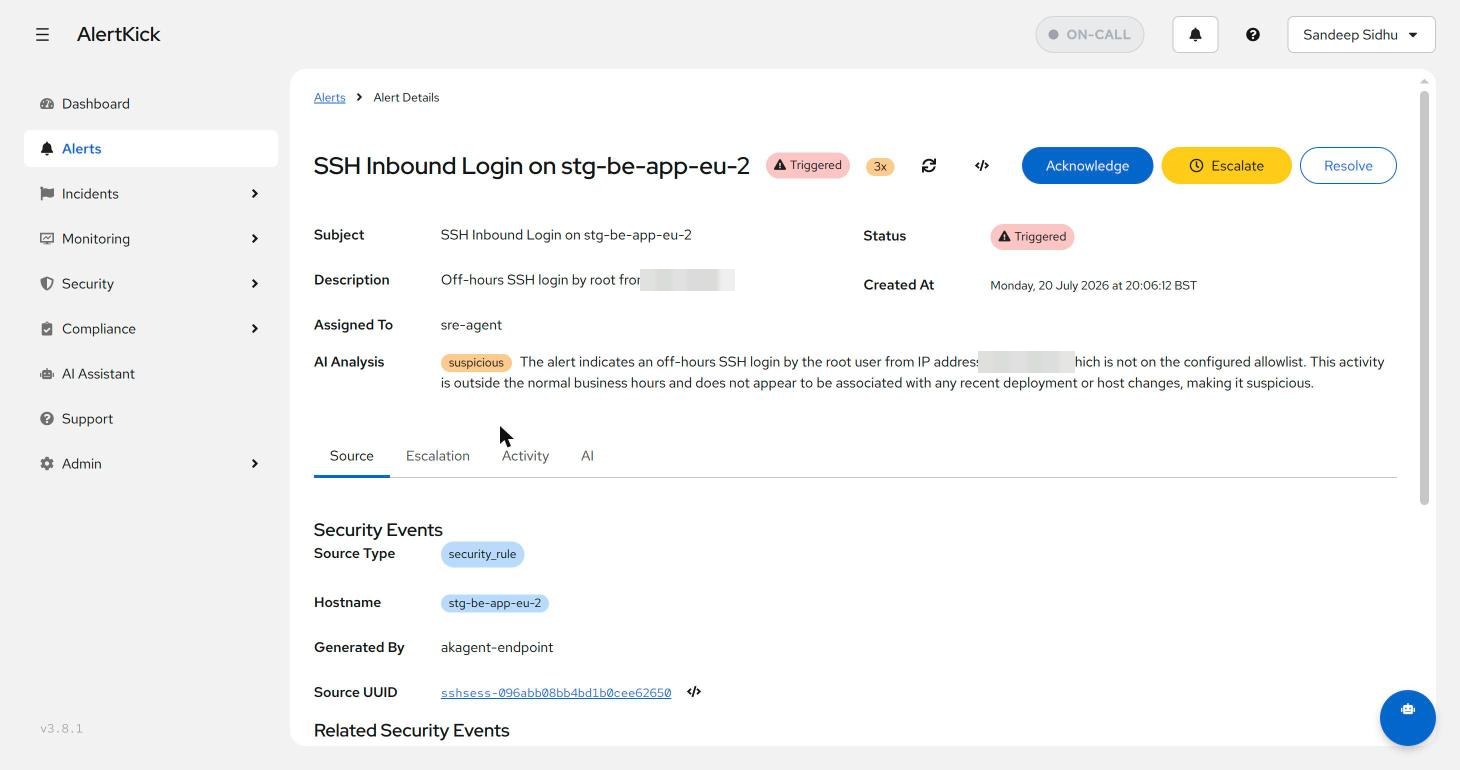
Top to bottom:
- Action buttons. Acknowledge claims the alert and pauses the escalation chain - it tells everyone else “handled”. Escalate skips the waiting and jumps the chain forward when you look at something and know immediately it’s bigger than you. Resolve closes it.
- Description - the concrete one-liner (“Off-hours SSH login by root from …”) rather than a rule ID.
- AI Analysis - the triage verdict and its reasoning, inline. Here the
model flagged the login as
suspiciousbecause the source address is not on the allowlist, it happened outside business hours, and it didn’t correlate with any deployment. You get the why, not just a label - which is the difference between trusting the verdict and re-deriving it at 3 AM. - Tabs - Source (below), Escalation, Activity (the audit trail of who did what when), and AI (ask follow-up questions about this alert in context).
Where did this come from: the Source tab
Every alert keeps a live link to its origin. For security-rule alerts that’s the originating event with hostname, the generating component, and a jump to the original security event plus all related events - so the path from “you got paged” to “here is the kernel-level evidence” is two clicks. For monitor alerts the same tab points at the check history. Nothing arrives context-free.
The Escalation tab
While an alert is unacknowledged, its policy is climbing. The Escalation tab shows exactly where things stand - which policy applies and how it was attached, the current level, when it last escalated, and how many times the chain has repeated:
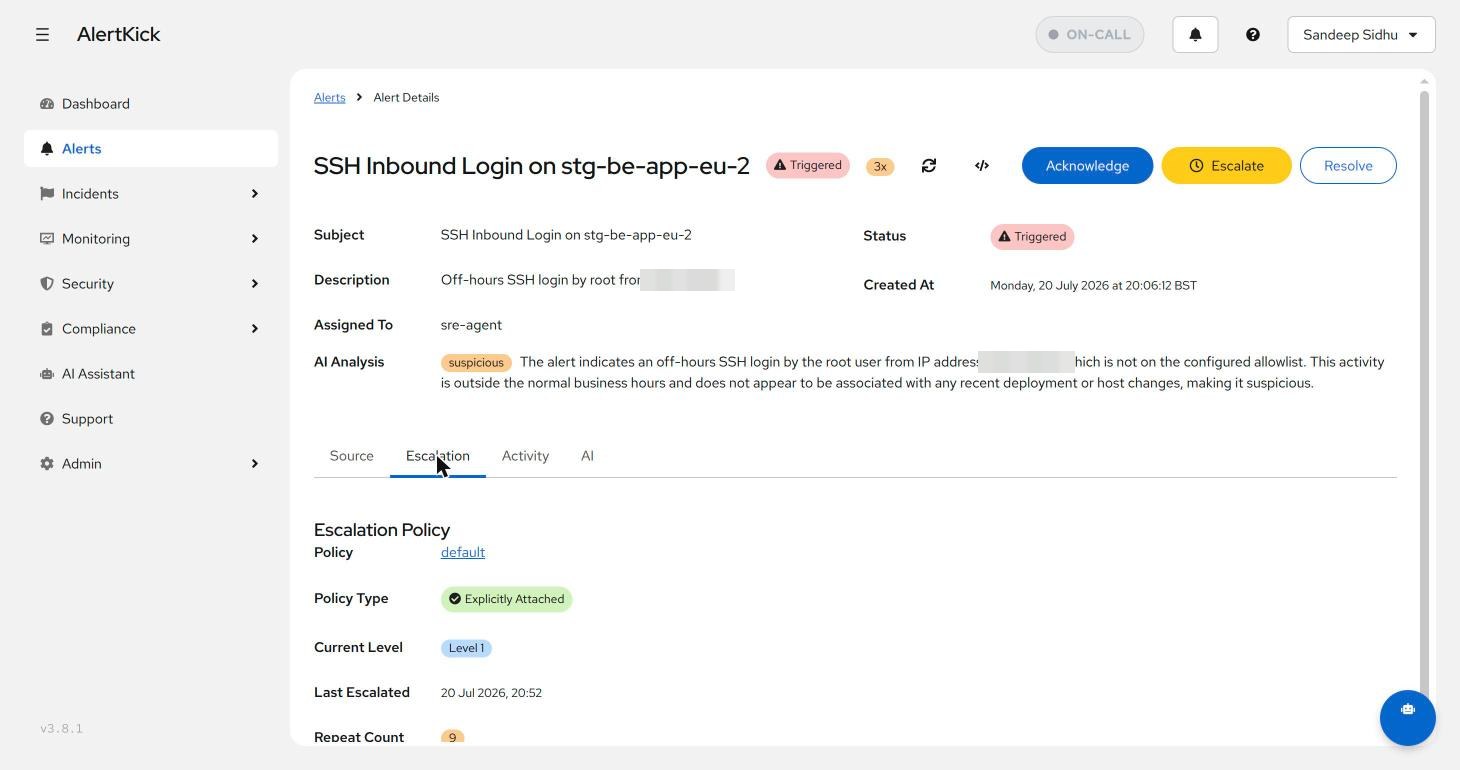
A repeat count in the double digits on a still-triggered alert is the system telling you the chain has gone all the way around without an acknowledgement - if that ever happens outside a test, the policy’s channels or targets need attention, not just the alert. See escalation policies for tuning the chain itself.
Lifecycle rules worth knowing
- Acknowledge stops the noise, not the problem. Escalation pauses, but the alert stays open and the repeat counter keeps counting if the condition re-fires. Resolve is the only terminal state.
- Auto-resolution. Monitor and heartbeat alerts resolve themselves when the underlying check recovers - so an alert that’s still open genuinely reflects a live condition, not stale state.
- Dedup is per host and rule. Three hosts with the same problem are
three alerts (you want to know the blast radius); one host firing the
same rule thirty times is one alert with a
30xbadge.
Next steps
- Route alerts properly with escalation policies and notification channels.
- For security-rule alerts, the security events guide covers the event stream they link back to.
Try it on your own infrastructure
Everything in this guide works on the free plan or the 30-day money-back paid tiers - uptime monitors, heartbeats, escalations and on-call, plus the agent for metrics and eBPF security. Setup takes minutes, not sprints.