The checks every server should have on day one
There's a short list of things that break a Linux server and a shorter list of checks that catch most of them. AlertKick ships all of them on by default. Here's the list, and why it's the list.
The AlertKick team
Every time a server has an incident, the people around it say the same thing in the post-mortem: we should have been alerting on that. And they’re right. The thing that broke was usually something that would have been obvious from one of a dozen signals. The reason it wasn’t caught is almost always that the monitoring was either not set up, or set up so long ago that nobody had revisited it.
The good news is that the list of signals worth watching on a generic Linux server is not secret and not long. Years of SRE work taught us which ones actually catch incidents and which ones just add noise. AlertKick ships the useful ones on by default the moment the agent is installed.
Here’s the list, and the opinion behind each entry.
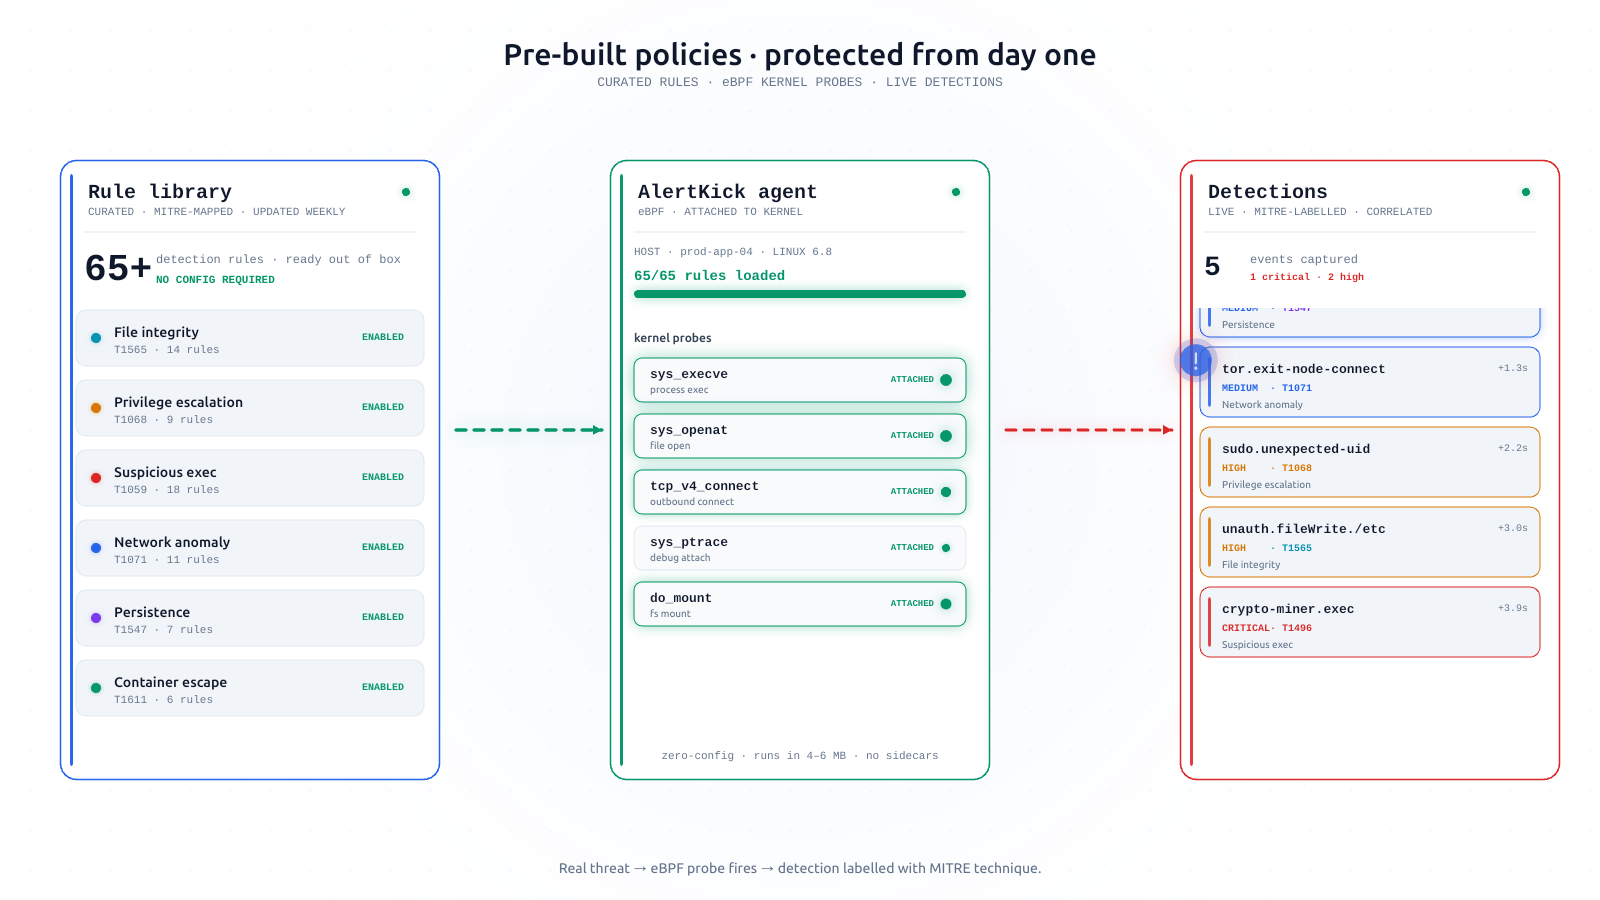
What’s on by default
Every host that joins AlertKick gets these checks automatically. You don’t configure them. You don’t enable them. The agent sees the host and switches them on.
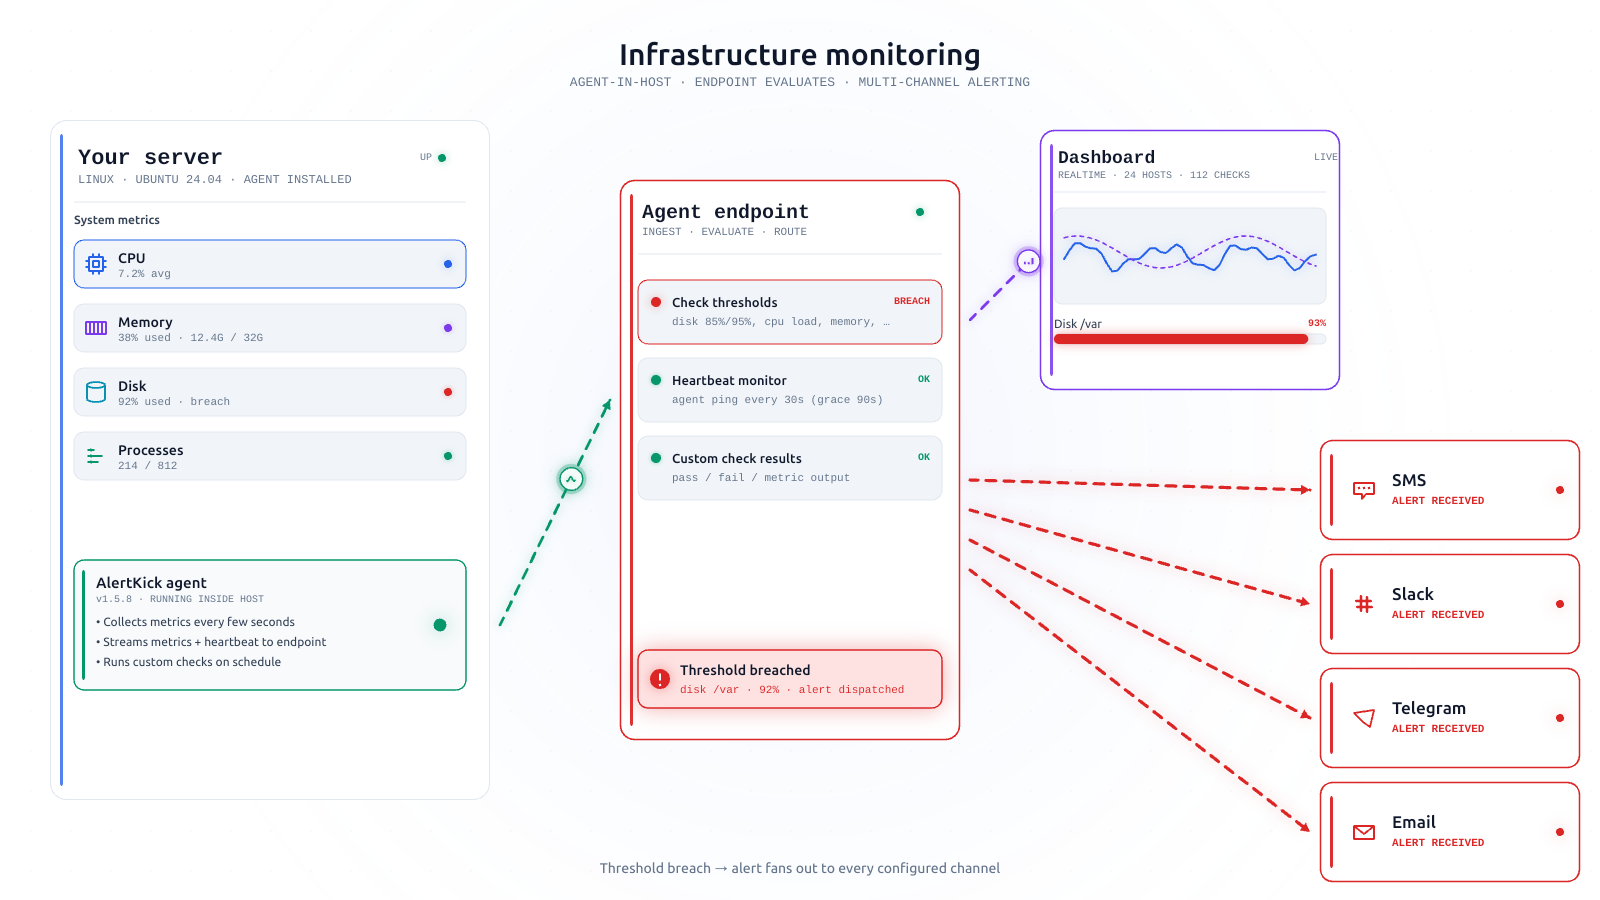
The golden three: CPU, memory, disk
These are obvious enough that it’s almost embarrassing to call them opinionated. But the opinions hide in the thresholds.
CPU. AlertKick doesn’t alert on instantaneous CPU. Busy systems go to 100% all the time and it’s fine. The signal that matters is sustained high load - load average over the 5-minute window exceeding the host’s core count by a ratio that reflects an unhealthy saturation, not just a busy moment. We also alert if a host stops reporting CPU entirely, because that usually means the agent (or the host) has stopped.
Memory. Free memory is the wrong metric. Linux uses all your free memory for cache - that’s good, not bad. The thing to watch is available memory, meaning memory that can actually be reclaimed for a new allocation. We alert when available dips below a threshold that scales with the host’s total RAM, and again when a process is killed by the OOM killer.
Disk. Disk is the most reliable incident-generator on the list. We alert on ”% used” passing a sensible threshold for each mount point, and - more importantly - we alert on velocity. If your /var partition has gained 15% of its capacity in the last hour, the time-to-alert matters more than the absolute number, because you’re going to run out soon.
We watch inodes with the same logic, separately from disk bytes. This catches the category of failure where a log directory fills up with a million tiny files but the disk usage looks fine.
Network and system health
Load average - classic, but paired with CPU count so that “high load” means something on both a 2-core VM and a 64-core bare-metal box.
Open file descriptors - the limit is real, the warning sign is the ratio of used-to-limit, not the absolute count.
Kernel errors - dmesg patterns that indicate hardware or filesystem trouble. These rarely trigger, but when they do, you very much want to know.
NTP drift - clocks drifting more than a few seconds are a leading indicator of a dozen different problems, from failing NTP sync to clock-source issues on a virtual host.
Service presence
If a host is running systemd, we know which units are supposed to be active (enabled) and which ones actually are. We alert when an enabled unit is not active, and we alert when a unit is flapping (repeatedly restarting).
If a host is running Docker, we know which containers are expected to be running and alert when one isn’t. Same with common service runtimes like nginx, Postgres, Redis, Kafka, and the like - if the agent sees the process, it starts monitoring the process, including whether its port is reachable.
You don’t have to tell us these services exist. The agent finds them and starts watching.
Process health
Zombie process count. A handful is normal. Hundreds means something is broken in a process tree.
Process restarts. A process that restarts frequently - say, more than a handful of times per hour - is a failing process even if nobody’s noticed.
What’s deliberately not on by default
Equally important to the list above is the list of checks we don’t turn on, even though a lot of monitoring tools ship them. A few examples:
Instantaneous CPU alerts. As mentioned: they alert constantly on healthy systems. Not useful.
“Network usage” alerts. High bandwidth is almost never an incident. Zero bandwidth on an interface that’s supposed to be talking to the world is an incident, but that’s a service-level alert, not a bandwidth alert.
“Process count” alerts. Generic process counts don’t correlate with any problem. Alerting on a specific critical process going missing is what actually helps.
Swap usage. For most modern workloads, swap presence is fine. It matters only when paired with memory pressure, which we already watch directly.
Every logline matching a regex. Generic log-pattern alerting has a signal-to-noise ratio that approaches zero without aggressive tuning. We have a better answer for “something weird happened”: eBPF-based runtime security, which watches behaviour, not text. (More on that here.)
The general principle: a check that fires on healthy systems isn’t a check, it’s a tax on attention.
Why shipping defaults matters
If you’ve run infrastructure for a while, none of the checks above will surprise you. The opinion isn’t in the list - it’s in the idea that these should already be on when you install the tool.
Most monitoring systems give you the building blocks for this list and ask you to assemble it yourself. Which sounds fine until you’ve done it four or five times across four or five teams, at which point you realise you’re re-deriving the same opinionated list every time, badly, and that the delta between “assembled this weekend” and “assembled properly” is about six months of refinement after actual incidents.
No team should have to pay that six-month cost. AlertKick is what those six months of refinement look like when someone hands them to you up front.
What you can change, and what you probably shouldn’t
For each default check, you can:
- Adjust the threshold. If you have a host that genuinely runs at 85% disk as its normal steady state, raise the bar for that host or group.
- Silence during maintenance. If you know something is about to get noisy, silence the relevant hosts or check types for a window.
- Disable it entirely. You can. You probably shouldn’t, but the choice is yours.
What you can’t do is flip a blank slate into “monitoring that makes sense”. AlertKick doesn’t offer that mode, because that mode doesn’t really exist.
When you do need a custom check
Some things are genuinely specific to your environment - a business metric, a domain-specific queue depth, a synthetic check against an internal endpoint. Those go into custom checks, which are short scripts (Bash, Python, Go - anything that returns an exit code and a value) that the agent runs on a schedule alongside the defaults. That’s the escape hatch.
The split is intentional: the defaults are what every server needs, and your custom checks are what your environment specifically needs. Nobody on your team should be writing the defaults.
Try it
Install the agent on a test host, wait a minute, and look at the checks list. Everything above will be running. If any of it isn’t what you’d have picked, let us know - these defaults are strong opinions but they’re not immovable, and an argument from someone who’s actually been on-call is the kind of input that shifts them.
Feature page for infrastructure monitoring. Get started - it takes about a minute.