Getting started with bpftrace: 12 one-liners that answer real production questions
A practical bpftrace tutorial for Linux engineers: install it, understand probes and the five-minute version of the language, then twelve copy-paste one-liners for tracing processes, file opens, network connections, slow disks, and kills - each tied to the production question it answers.

The AlertKick team
Some production questions cannot be answered by logs, because nothing logged them, or by metrics, because nobody predicted them. Which process keeps writing these temp files? What is spawning these short-lived children? Who connects to the database at 3 AM? bpftrace answers this class of question on a live host, in one line, without restarting anything.
This is the tutorial that gets you from zero to using it for real: the five-minute language, then twelve one-liners each tied to the question it answers.
Install and verify
# Ubuntu / Debian
sudo apt install -y bpftrace

# RHEL / Alma / Rocky
sudo dnf install -y bpftrace

# verify - counts syscalls per process for a second or two
sudo bpftrace -e 'tracepoint:raw_syscalls:sys_enter { @[comm] = count(); }'
Press Ctrl-C and it prints a table. That interaction pattern - attach, collect, Ctrl-C, report - is most of what you will do.
bpftrace needs root, and on modern kernels (5.8+, BTF enabled - any current mainstream distro) needs nothing else. On something older or unusual, check your kernel’s eBPF support here before debugging an install that was never going to work.
The language in five minutes
A bpftrace program is probe /filter/ { action }:
tracepoint:syscalls:sys_enter_openat   # probe: where to attach
/comm == "postgres"/                   # filter: optional condition
{ printf("%s\n", str(args->filename)); }  # action: what to do
What you need to know, in full:
- Probes.
tracepoint:*are stable kernel instrumentation points - prefer them.kprobe:*attach to arbitrary kernel functions (powerful, less stable across versions).interval:s:5fires on a timer, useful for periodic prints. - Built-in variables.
comm(process name),pid,uid,args->...(the tracepoint’s arguments),retval(return value, in exit probes),nsecs(timestamp). - Maps.
@name[key] = ...is an associative array; every map is automatically printed on exit. Aggregation functions:count(),sum(x),avg(x),hist(x)(power-of-two histogram). str(). Kernel pointers to strings must be wrapped:str(args->filename).
That is genuinely the whole mental model. On to the one-liners.
Processes: what is running, and who started it
1. Every new process, with its parent - the question behind “something keeps running and we don’t know what”:
sudo bpftrace -e 'tracepoint:syscalls:sys_enter_execve
  { printf("%-16s pid %-6d -> %s\n", comm, pid, str(args->filename)); }'
The comm printed is the parent’s name at exec time - so this shows cron -> /usr/local/bin/backup.sh, which is usually the answer itself.
2. Full command lines, not just binaries:
sudo bpftrace -e 'tracepoint:syscalls:sys_enter_execve
  { join(args->argv); }'
3. Count process launches by binary - is that “occasional” script actually running 400 times an hour?
sudo bpftrace -e 'tracepoint:syscalls:sys_enter_execve
  { @execs[str(args->filename)] = count(); }'
4. Who is killing my process - for the service that keeps dying with no log line:
sudo bpftrace -e 'tracepoint:syscalls:sys_enter_kill
  { printf("%s (pid %d) sent signal %d to pid %d\n",
    comm, pid, args->sig, args->pid); }'
If the killer is oom_reaper or nothing appears at all, look at the kernel OOM killer and cgroup limits instead - those paths do not go through kill().
Files: who touches what
5. Every file a specific process opens - the “what config is it actually reading” classic:
sudo bpftrace -e 'tracepoint:syscalls:sys_enter_openat
  /comm == "nginx"/ { printf("%s\n", str(args->filename)); }'
6. Who is writing to a directory - mystery files appearing in /tmp:
sudo bpftrace -e 'tracepoint:syscalls:sys_enter_openat
  /strcontains(str(args->filename), "/tmp/")/
  { printf("%s (pid %d): %s\n", comm, pid, str(args->filename)); }'
7. Failed opens - the app that silently falls back to defaults because its config path is wrong:
sudo bpftrace -e 'tracepoint:syscalls:sys_exit_openat
  /retval < 0/ { @fails[comm, retval] = count(); }'
Network: who talks to whom
8. Every outbound TCP connection as it happens:
sudo bpftrace -e 'kprobe:tcp_connect
  { printf("%s (pid %d) connecting\n", comm, pid); }'
Getting the destination address needs a longer script (it lives in kernel structs), and at that point use tcpconnect from the bcc tools, which does it properly - the right tool boundary, not a bpftrace failure.
9. Which processes are doing DNS lookups (UDP sends to port 53 mean the resolver cache is being missed):
sudo bpftrace -e 'kprobe:udp_sendmsg
  { @dns[comm] = count(); }'
Performance: where the time goes
10. Disk I/O latency histogram - “is the disk actually slow or does everyone just say that”:
sudo bpftrace -e 'kprobe:blk_mq_start_request { @start[arg0] = nsecs; }
  kprobe:blk_mq_end_request /@start[arg0]/
  { @usecs = hist((nsecs - @start[arg0]) / 1000); delete(@start[arg0]); }'
A healthy SSD histogram clusters under ~1ms. A long tail into tens of milliseconds during your slow requests is the answer.
11. Syscall count by process - the cheapest possible “what is this box even doing”:
sudo bpftrace -e 'tracepoint:raw_syscalls:sys_enter { @[comm] = count(); }'
12. Short-lived processes eating CPU invisibly - things that start and exit between two top refreshes:
sudo bpftrace -e 'tracepoint:sched:sched_process_exit
  { @lifetime_ms[comm] = hist((nsecs - curtask->start_time) / 1000000); }'
A fat bucket at 1-4ms with a huge count is the fork-storm signature: something is spawning thousands of tiny processes, and per-process CPU accounting never catches any single one of them.
Where tracing stops and monitoring starts
Notice the shape of every question above: present tense. bpftrace is superb the moment you are on the host, suspicious, and asking. It has nothing to say about last night - when the mystery process ran at 03:14, your one-liner was not attached, and no aggregation you forgot to start can be run retroactively.
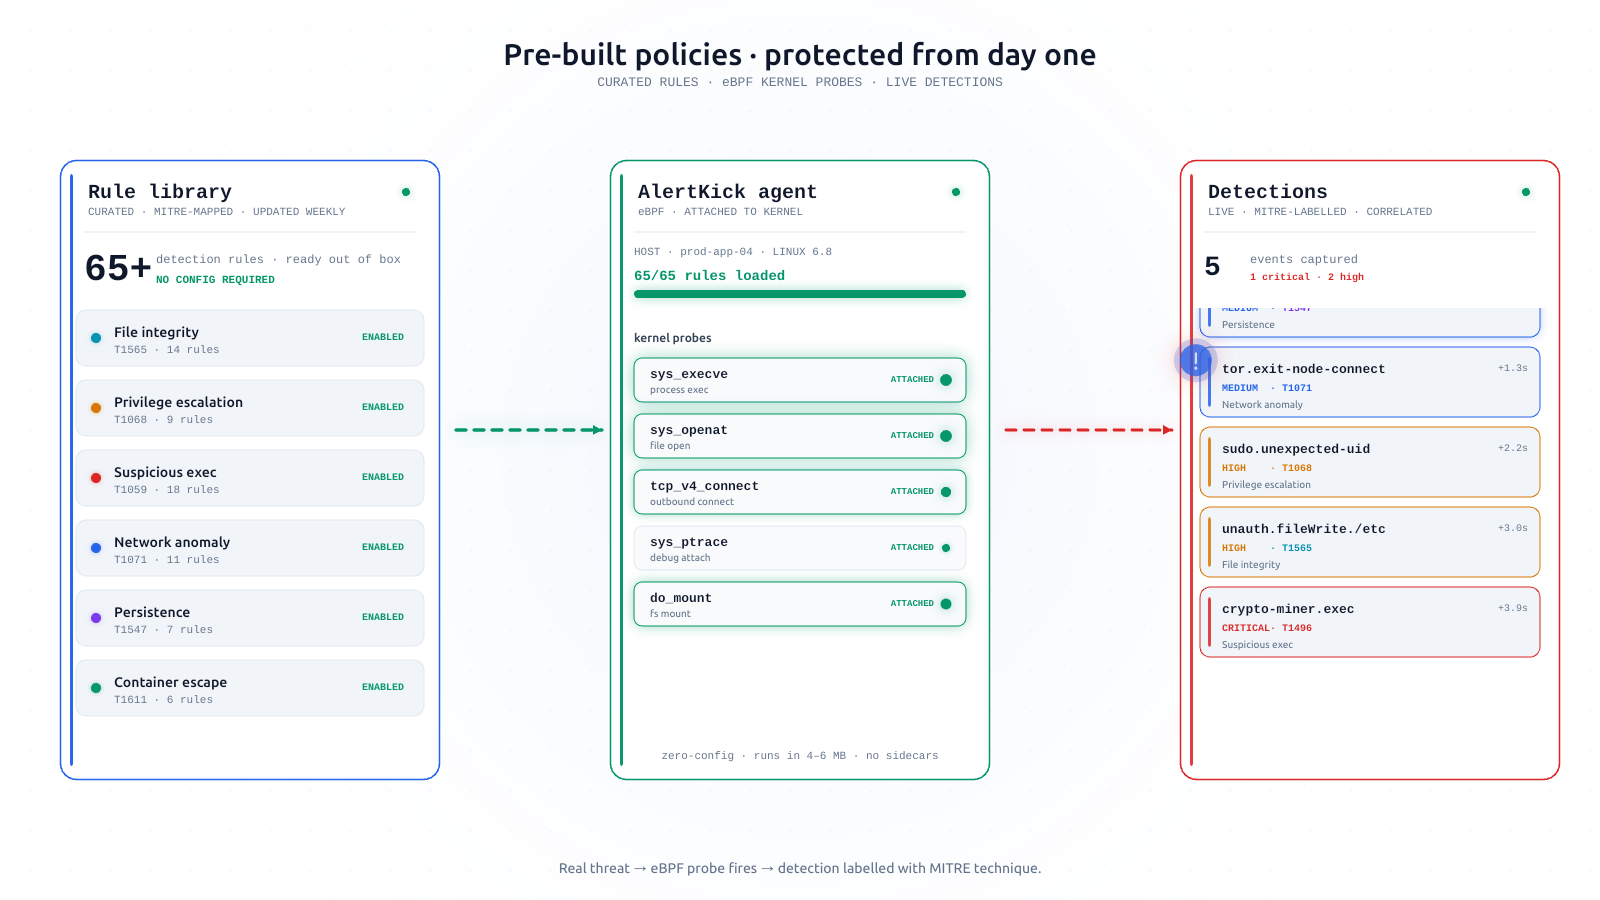
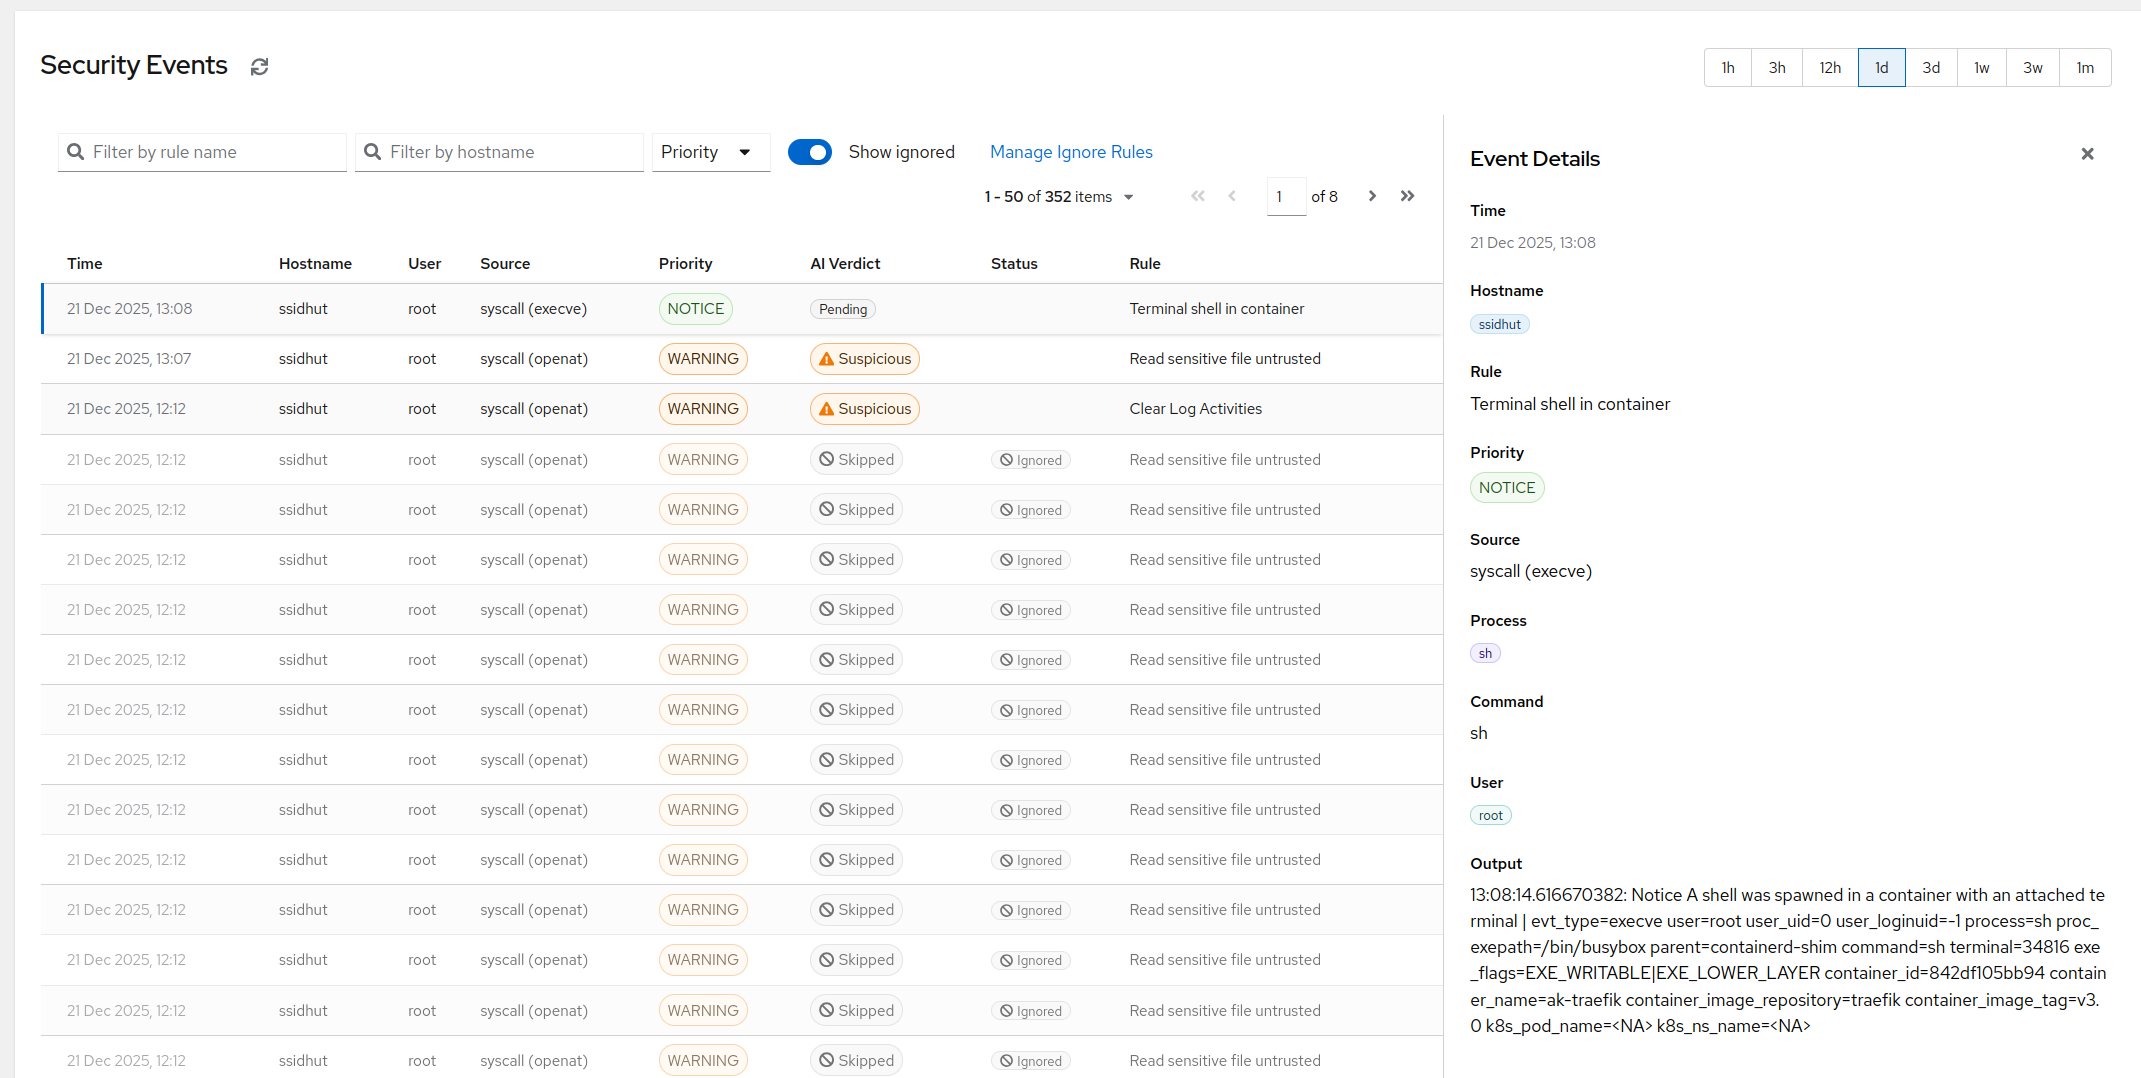
That is the actual boundary between tracing and monitoring, and it is why the two are complements rather than rivals. The continuous version of one-liners #1, #5, and #8 - every process execution, sensitive file access, and network connection, captured 24/7 at the kernel, kept as history, and watched by detection rules with AI triage on top - is exactly what AlertKick’s eBPF agent does. Install it once and the next “what ran on this box last night?” is a search, not a séance; the one-liners stay in your kit for everything else. Start free - it takes about a minute, which is less time than one of the histograms above needs to fill.