The best open-source eBPF tools in 2026: what to use for tracing, security, and networking
A field guide to the eBPF ecosystem's most useful open-source projects - bpftrace, bcc, Falco, Tetragon, Cilium, Inspektor Gadget, ebpf_exporter, bpftop, and pwru - what each one is actually for, what it costs to operate, and how to pick.

The AlertKick team
eBPF let programs run safely inside the Linux kernel, and an entire ecosystem of tooling grew on top of it - tracing, security, networking, profiling. The ecosystem’s problem is not quality, it is navigation: a dozen serious projects with overlapping descriptions, and the honest answer to “which one?” is always “for what?”.
This is the map. Nine projects that have earned their place, grouped by the job they actually do, with the operating cost stated out loud - because with eBPF tooling the install is never the expensive part.
Ad-hoc tracing: your first eBPF tools
bpftrace
If you learn one tool from this list, learn bpftrace. It is an awk-like language for the kernel: attach to a tracepoint, kprobe, or perf event, filter, aggregate, print. One line of it answers questions that are otherwise unanswerable on a live production host:
# every new process, live
bpftrace -e 'tracepoint:syscalls:sys_enter_execve { printf("%s -> %s\n", comm, str(args->filename)); }'

# who is opening which files
bpftrace -e 'tracepoint:syscalls:sys_enter_openat { printf("%s %s\n", comm, str(args->filename)); }'
Operating cost: near zero. It is a package install, runs as root when you need it, and is gone when you close the terminal. There is a full getting-started guide with a dozen production one-liners on this blog.
bcc
The original eBPF toolkit: a framework for writing eBPF tools in Python and C, plus the famous collection of ready-made tools it ships - execsnoop, opensnoop, tcpconnect, biolatency, cachestat, and about a hundred more. Most distros package the collection as bpfcc-tools.
Use the shipped tools freely - they are excellent and battle-tested. Write new tools in bcc only when bpftrace runs out of expressiveness; for new standalone tooling the ecosystem has largely moved to libbpf with CO-RE, which produces small portable binaries instead of compiling at runtime.
Runtime security: watching for attackers
Falco
github.com/falcosecurity/falco
The CNCF-graduated standard for syscall-based threat detection: a rules engine over kernel events, with a community rule set covering shells in containers, sensitive file reads, privilege escalation patterns, and much of the MITRE ATT&CK matrix. Runs on plain VMs and bare metal as happily as on Kubernetes.
Operating cost: the highest on this list relative to its install effort, and it is important to be clear-eyed about why. The engine is free; the pipeline is on you - output routing to somewhere humans look, deduplication, and above all rule tuning, which is a standing weekly loop, not a launch task. We wrote a two-part deep dive: installing and configuring Falco and the rule language and tuning workflow.
Tetragon
Cilium’s security observability and enforcement engine. Where Falco observes and reports, Tetragon can also act - kill a process the moment it matches a policy, before the damage syscall returns. Policies are Kubernetes CRDs, filtering happens in-kernel (cheap), and identity is container/pod-native.
Choose it when you are already in the Cilium ecosystem on Kubernetes and want enforcement. On plain fleets, or without k8s, Falco’s maturity and rule library win.
Networking and packet-level debugging
Cilium
The project that made eBPF famous: a Kubernetes CNI that replaces kube-proxy and iptables chains with eBPF programs, adding network policy, load balancing, and (via Hubble) flow-level observability. If you run Kubernetes at any real scale it is the default answer to networking; if you do not run Kubernetes, it is not for you, and that is fine.
pwru
“Packet, where are you” - the tcpdump of kernel internals. Where tcpdump shows a packet arriving and (maybe) leaving, pwru traces the packet through the kernel: every function it passes, and crucially where it gets dropped and why. For “the SYN arrives but nothing answers and iptables looks fine” mysteries, nothing else comes close. Single static binary, run it when needed.
Metrics and profiling
ebpf_exporter
github.com/cloudflare/ebpf_exporter
Cloudflare’s bridge from eBPF to Prometheus-style metrics: you define eBPF programs in YAML + C, it exposes the aggregates as a scrape endpoint. This is how you get metrics that do not otherwise exist - disk latency histograms per operation type, TCP retransmit counters per destination, run-queue latency. Sharp tool, assumes you already run a metrics stack and are comfortable writing kernel-side code.
bpftop
Netflix’s top for eBPF programs themselves: which programs are loaded, how often they run, and what they cost in CPU. The moment more than one thing on this list is running on the same host, bpftop is how you find out which one is eating the budget. Zero-config single binary.
Kubernetes-native inspection
Inspektor Gadget
github.com/inspektor-gadget/inspektor-gadget
The bcc tool collection, repackaged for Kubernetes: kubectl gadget trace exec, trace open, top tcp, and friends, with every event enriched with pod/namespace/container identity instead of bare PIDs. If you have ever tried to correlate a bcc trace with “which pod was that?”, this is the fix. Deploys as a DaemonSet; remove it when not investigating if you are footprint-sensitive.
Choosing, honestly
| You want | Reach for |
|---|---|
| Answer a live question on one host, now | bpftrace |
| Ready-made tracing tools, no code | bcc tools |
| Threat detection on VMs / mixed fleets | Falco |
| Threat detection + enforcement on k8s with Cilium | Tetragon |
| Kubernetes networking | Cilium |
| ”Where did my packet go” | pwru |
| Kernel metrics into your dashboards | ebpf_exporter |
| Cost accounting of eBPF itself | bpftop |
| bcc-style tracing with pod identity | Inspektor Gadget |
Every one of these is genuinely free to install. The distinction that matters is what each costs to keep: the tracing tools (bpftrace, bcc, pwru, bpftop) cost nothing between uses and belong in every Linux engineer’s kit. The platforms (Falco, Tetragon, Cilium, ebpf_exporter) are infrastructure - they need an owner, an update cadence, a tuning loop, and a pipeline to the humans on call.
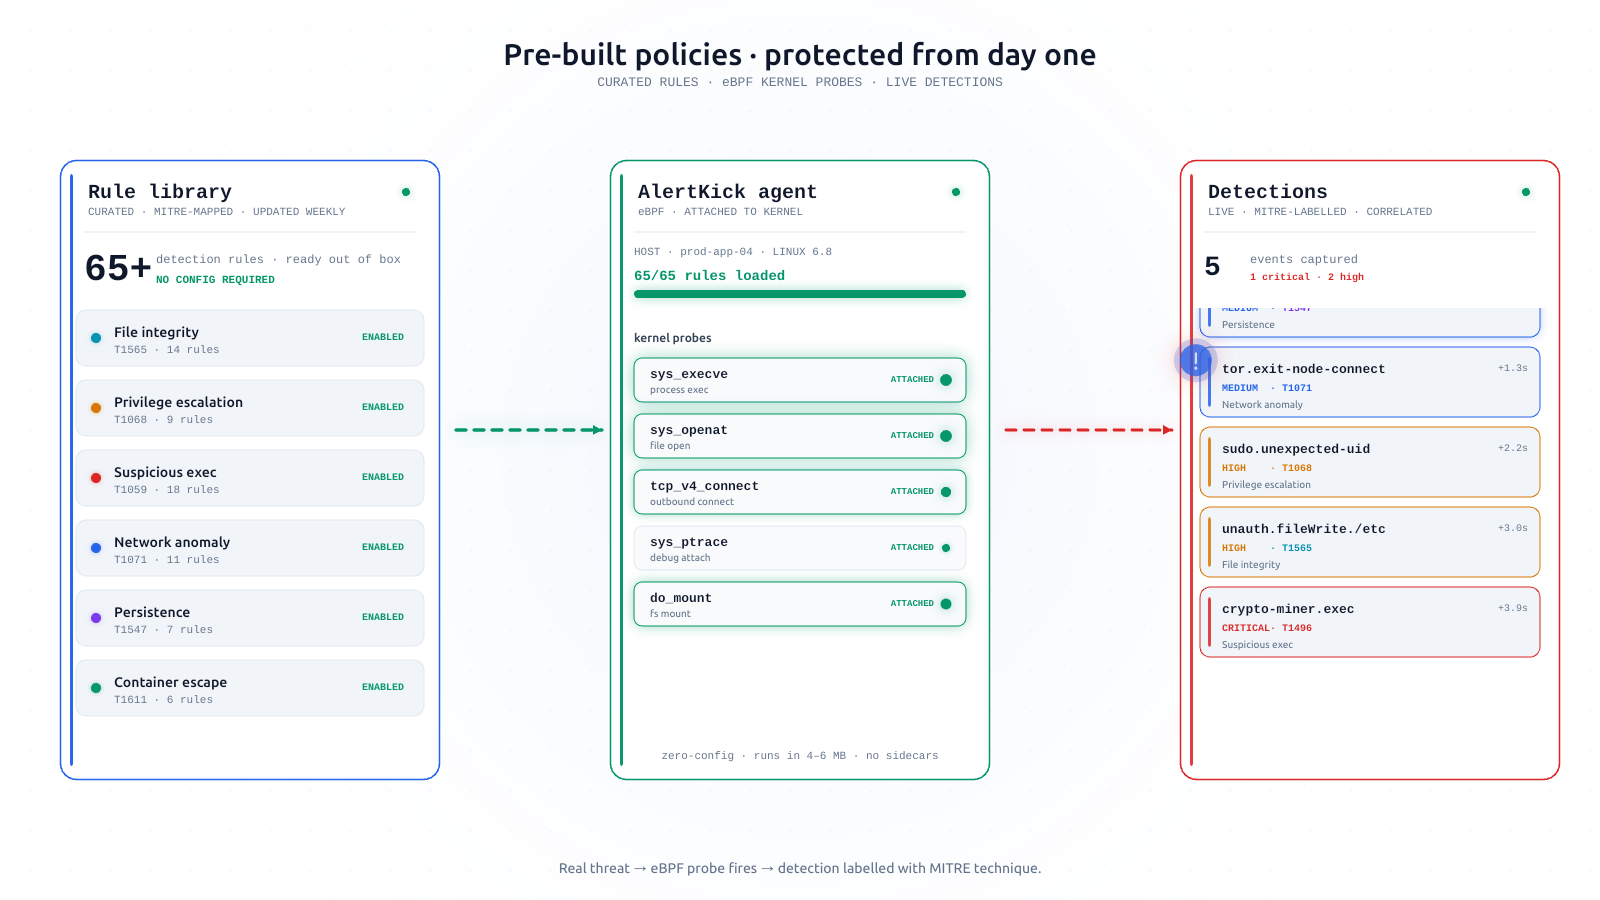
That gap - between “the kernel visibility is free” and “the outcome costs an engineer” - is exactly the gap AlertKick exists to close for the security use case: one agent that ships the eBPF detections (shell-in-container, credential reads, reverse shells, crypto miners, fileless execution), MITRE ATT&CK mapping, AI triage of the event stream, and the alerting and on-call layer, from £5/month. Run bpftrace with our blessing - and let the security platform be someone else’s pager.