Monitor a website
Create your first uptime monitor - HTTP checks from multiple locations, SSL expiry tracking, response-time thresholds, and the escalation policy that decides who gets told when it breaks.
Updated
A monitor is an external check that runs on a schedule: request a URL, compare what comes back against what you expected, and raise an alert when they stop matching. No agent required - this is the half of AlertKick you can set up before installing anything on a server.
Create the monitor
Monitoring, then Monitors, then Add New. Name it after what a human would recognise in a page (“Marketing website”, not “http-check-7”), pick the monitor type, and choose where to check from:
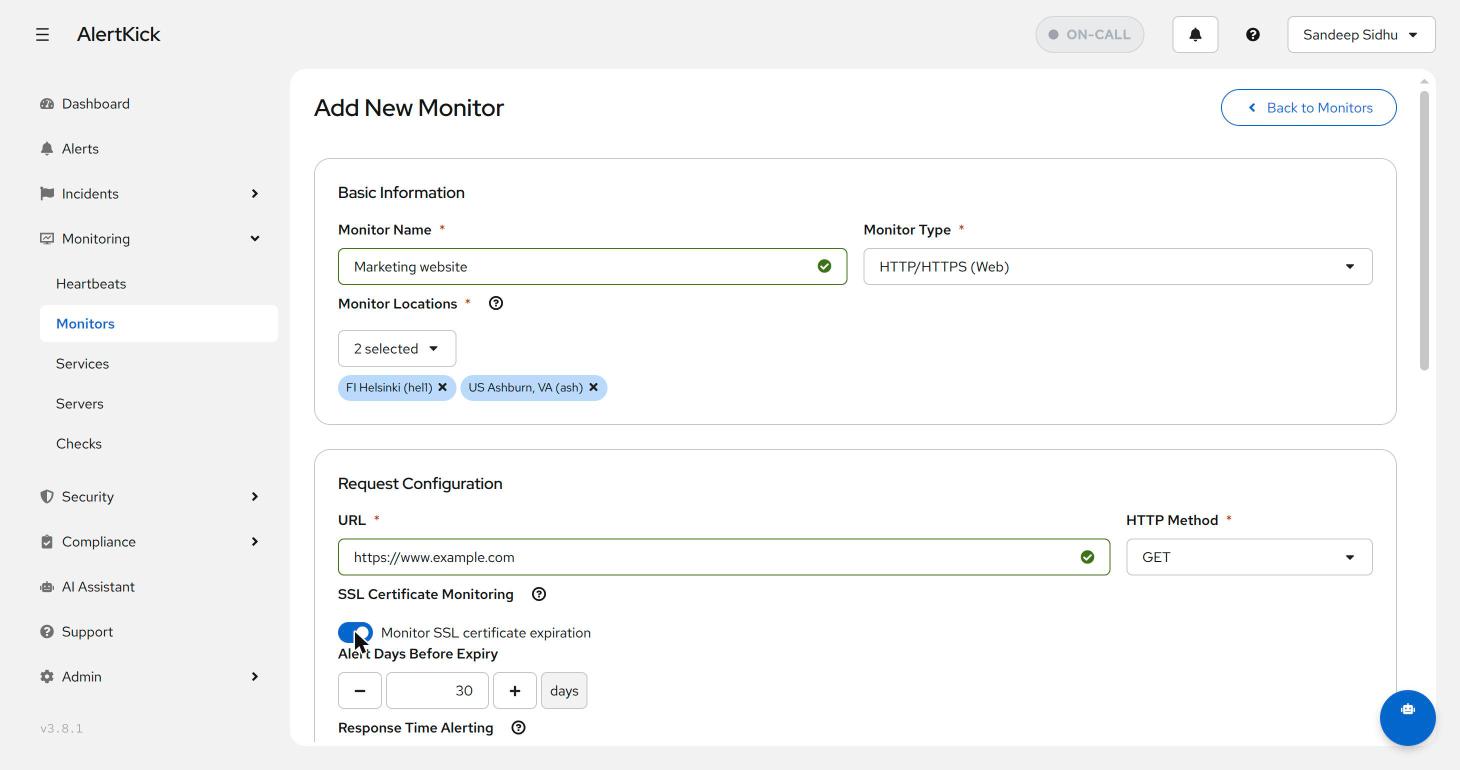
Three decisions on this screen matter more than the rest:
Type. HTTP/HTTPS covers websites and is what you want first. The other types cover the rest of the estate - API endpoints (with body assertions), DNS records, raw TCP ports, and domain registration expiry:
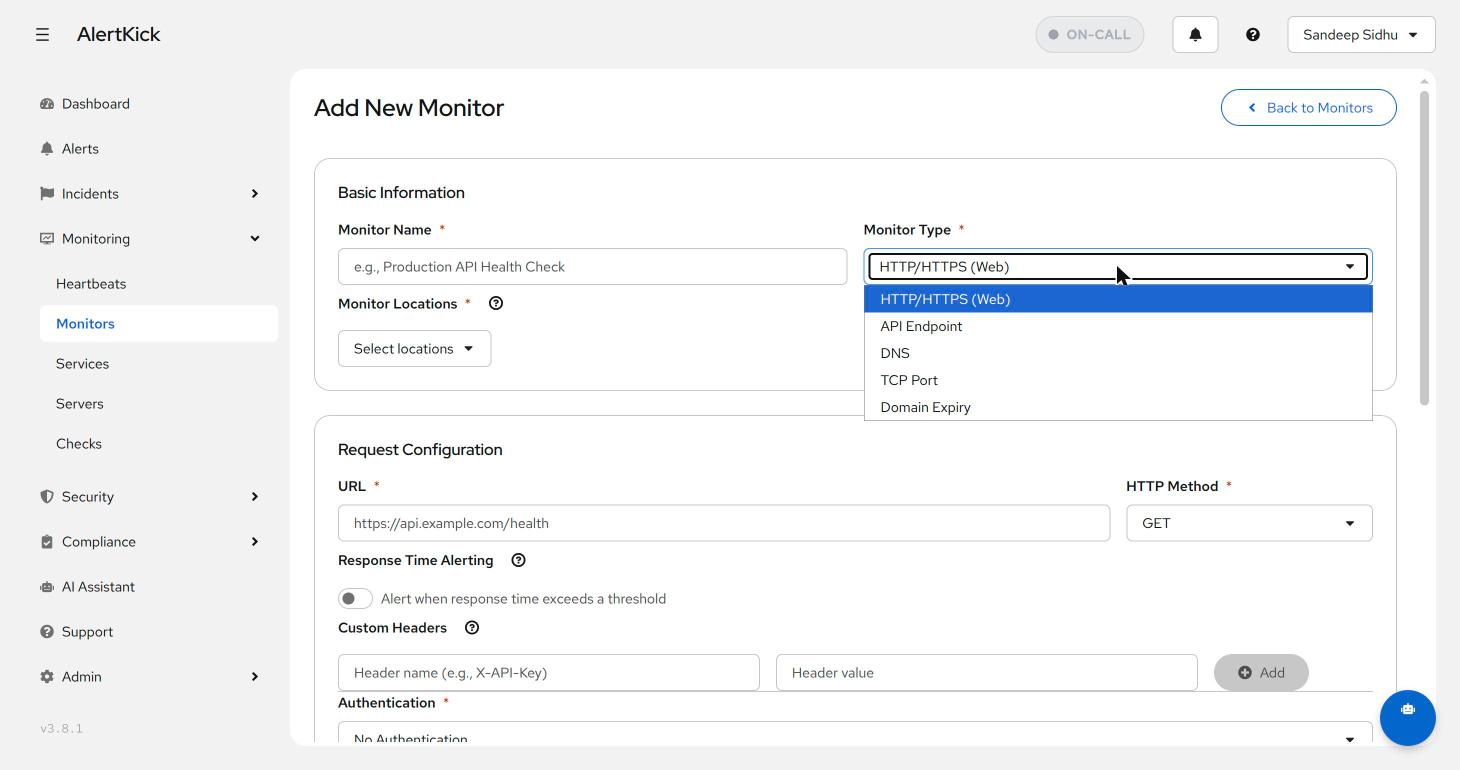
Locations. Pick at least two. A single vantage point can’t tell a real outage from a network blip between one datacentre and yours - two locations that agree can. The list shows AlertKick’s regions plus any on-premises pollers you’ve deployed inside your own network, which is how you monitor internal services with the same dashboard.
SSL certificate monitoring. The moment you enter an https:// URL, the
form offers to track the certificate too. Leave it on. Expiry alerts default
to 30 days out - enough runway to fix a broken renewal pipeline calmly. If
you only want the certificate watched, this toggle plus a long check
interval is all you need.
Timing, status, and response time
Further down: timeout, check interval, and the expected status code. The defaults (30s timeout, check every 60 seconds, expect 200) are right for most sites. Two adjustments worth knowing about:
- Response Time Alerting - alert when the site is technically up but slower than a threshold you set. Degradation usually arrives before downtime; this is the check that catches the saturating database pool a day early.
- Expected status code - set it to what the endpoint really returns. A login-walled page that 302s is healthy when it redirects; expecting 200 there would page you forever.
Who gets told: the escalation policy
Every monitor ends with an escalation policy binding. This is the part that turns a red dashboard tile into a person actually finding out:
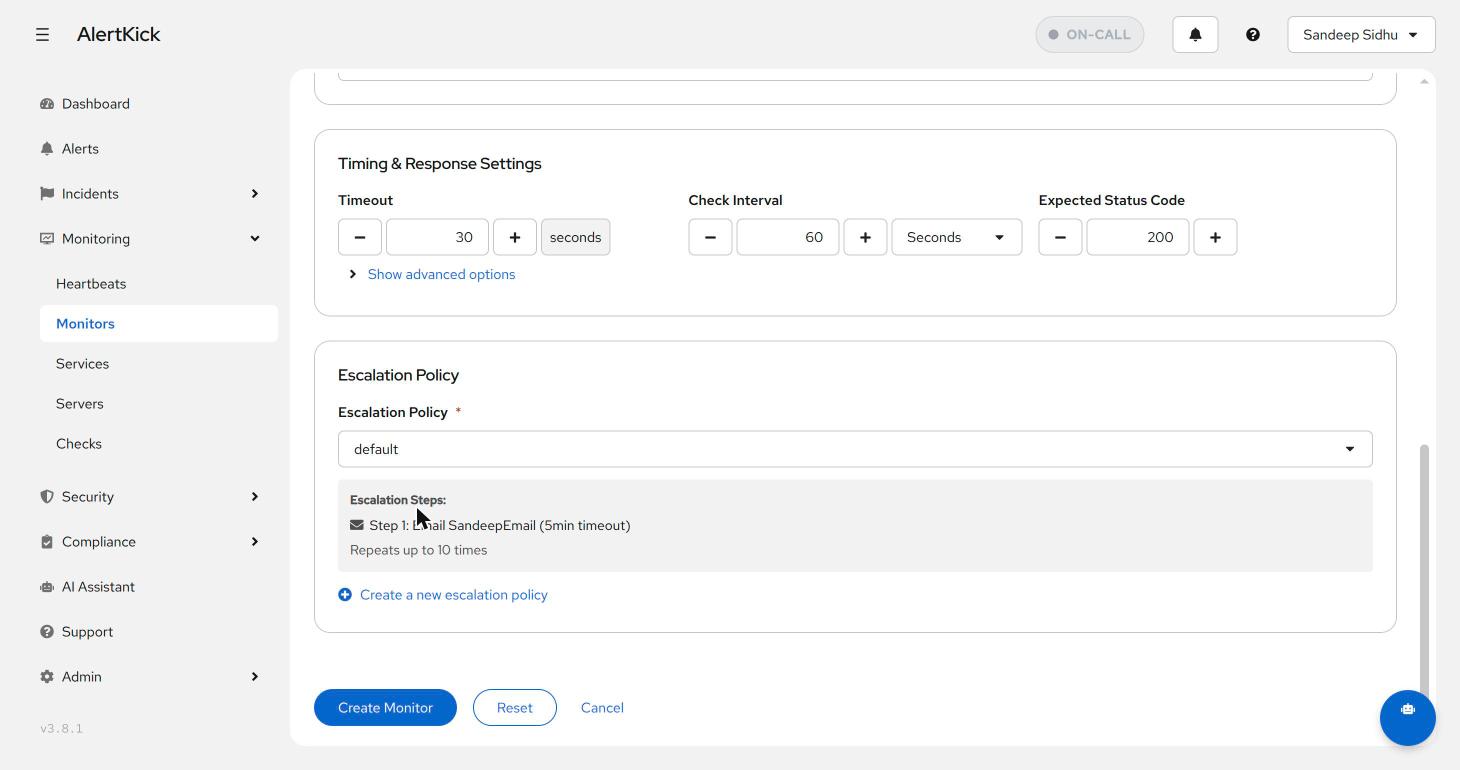
The panel previews the selected policy’s steps so you can sanity-check the chain without leaving the form, and “Create a new escalation policy” jumps you to the policy editor if none of the existing ones fit. See escalation policies for how to build a good one.
The list view
Back on the Monitors page, every check shows its enabled state, current status, a rolling health percentage, and the last check time:
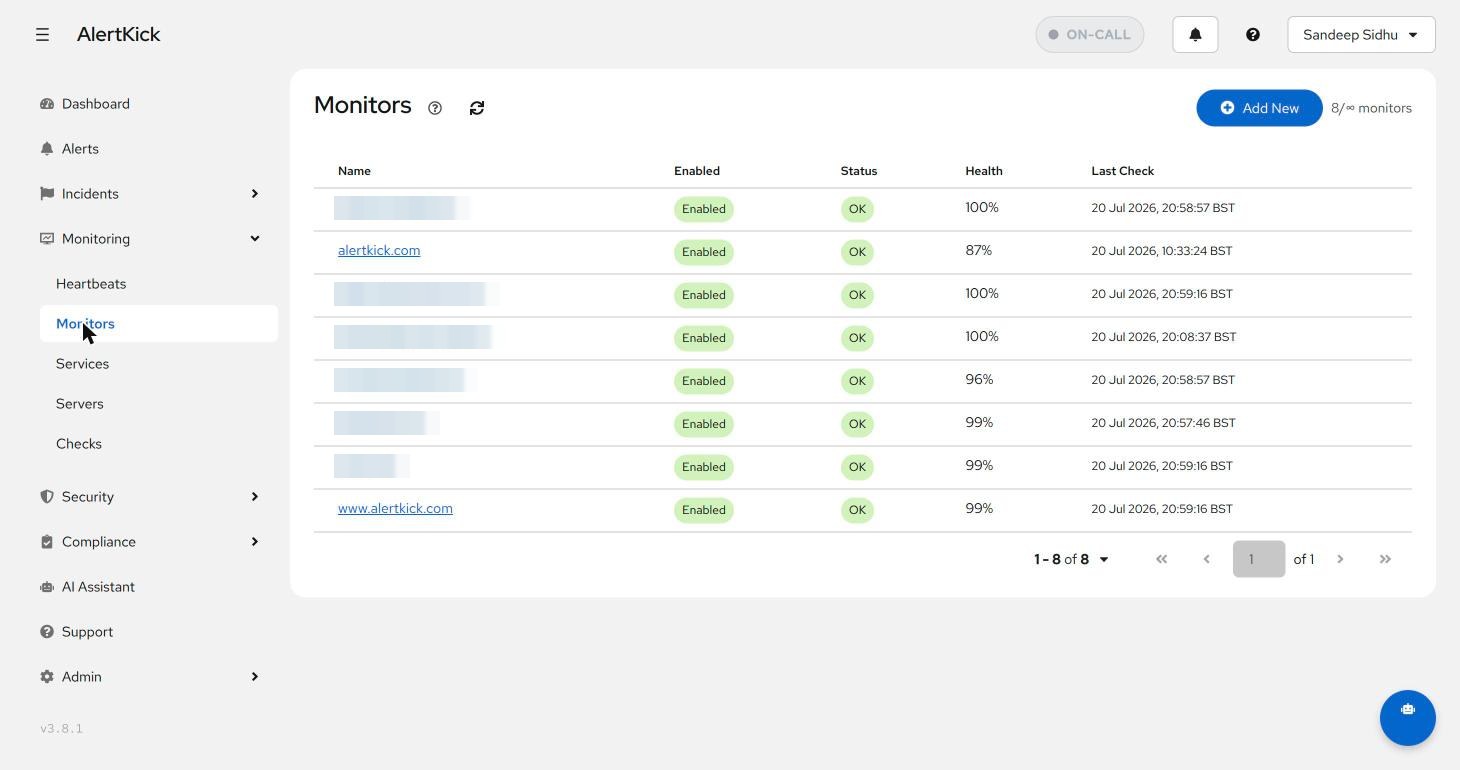
Health below 100% with status OK means the monitor has flapped recently - worth a look at its history even though nothing is firing right now.
Next steps
- Add a heartbeat for the scheduled jobs behind the site - backups and cron don’t have URLs, and uptime checks can’t see them.
- Wire the policy to a roster so the pager follows the rotation, not a hardcoded person.
- For the inside view (CPU, disk, logs, kernel-level security), install the agent.
Try it on your own infrastructure
Everything in this guide works on the free plan or the 30-day money-back paid tiers - uptime monitors, heartbeats, escalations and on-call, plus the agent for metrics and eBPF security. Setup takes minutes, not sprints.