Compliance evidence and reports
Turn on SOX and PCI-DSS 4.0 monitoring, watch evidence accumulate against each framework, and generate the audit-ready reports - executive summary, server inventory, and control-by-control event evidence.
Updated
Compliance in AlertKick is not a separate product bolted onto monitoring - it is the same security event stream, tagged. Detection rules carry framework mappings (SOX, PCI-DSS 4.0), so every event a tagged rule generates is simultaneously an alert-worthy signal and a piece of audit evidence. The Compliance section is where that evidence is scoped, browsed, and frozen into reports an auditor can take away.
Turning it on
Framework monitoring has two switches, and both live outside the Compliance section because they configure detection, not reporting.
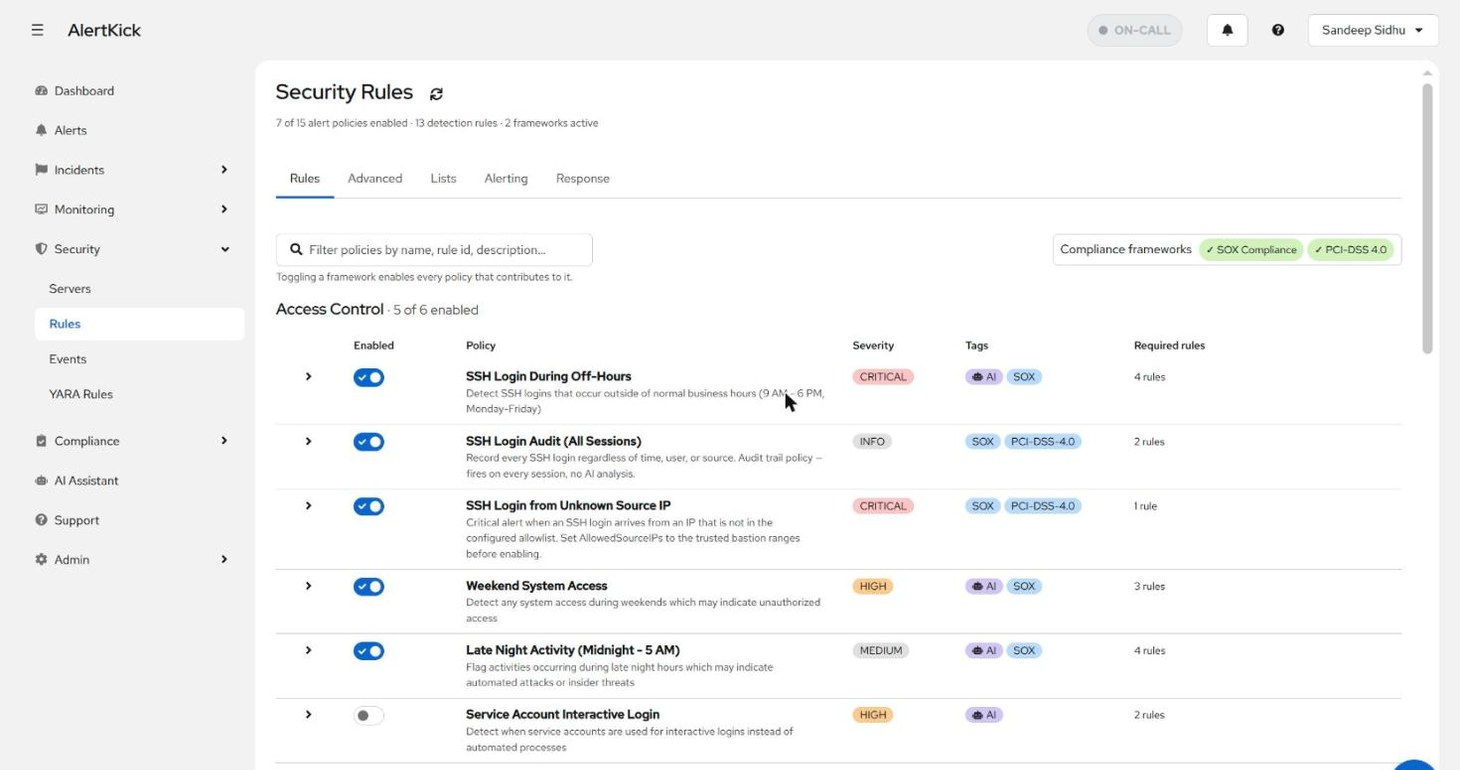
Tenant-wide: Security -> Rules. The Compliance frameworks chips at
the top right enable SOX and PCI-DSS 4.0 for the account. Toggling a
framework on enables every alert policy that contributes rules to it -
you can see which ones in the Tags column (SOX, PCI-DSS-4.0):
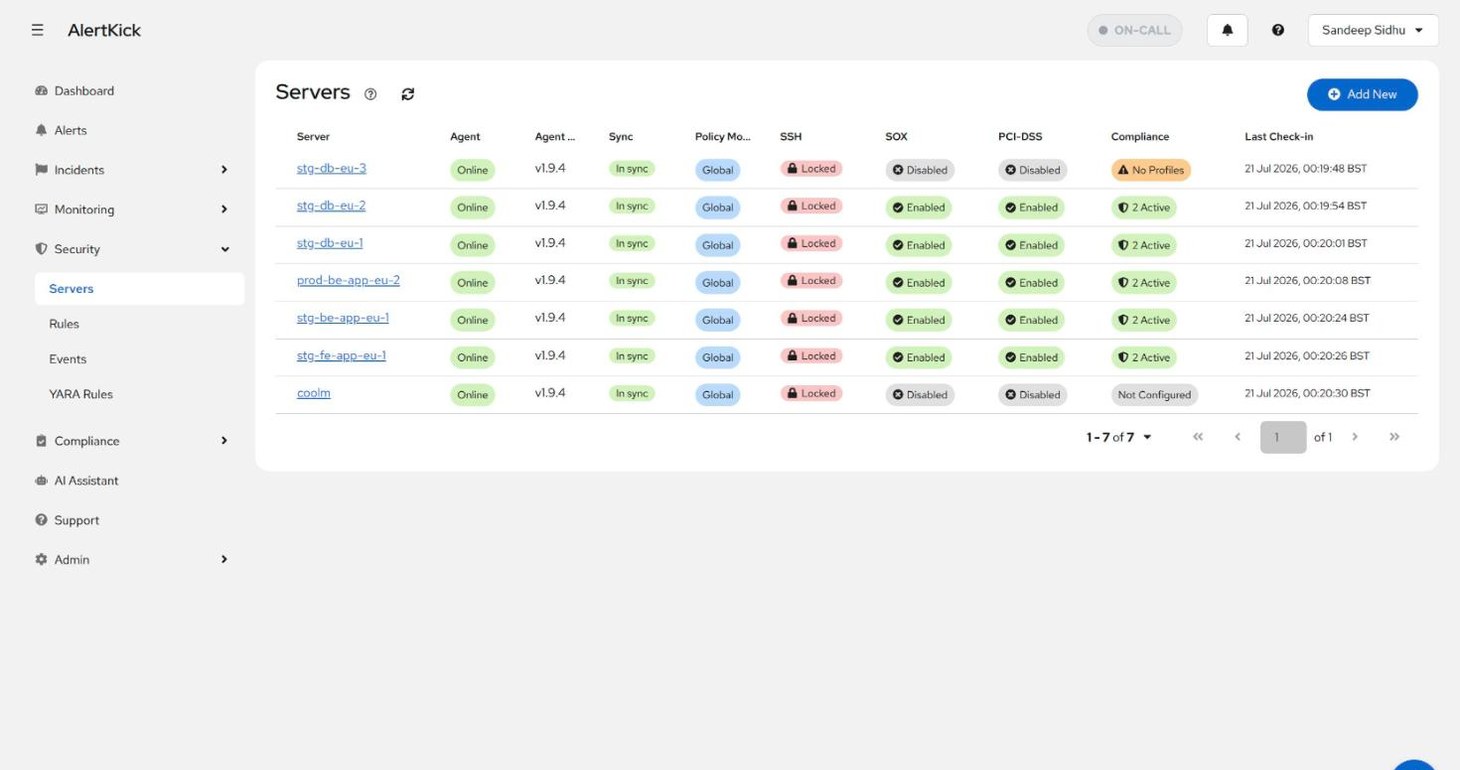
Per server: Security -> Servers. Each server row shows whether SOX and PCI-DSS monitoring are enabled on that host’s agent, and the Compliance column summarises the active profiles. A server showing No Profiles is online but contributing no compliance evidence - worth fixing before an audit window, not during:
The Compliance dashboard
Compliance -> Overview answers the coverage question at a glance: how many servers are online, how many have compliance profiles, and per framework, how many are enabled - with a coverage bar per framework so a gap (“5 of 7 online servers have SOX monitoring enabled”) is visible before an auditor finds it:
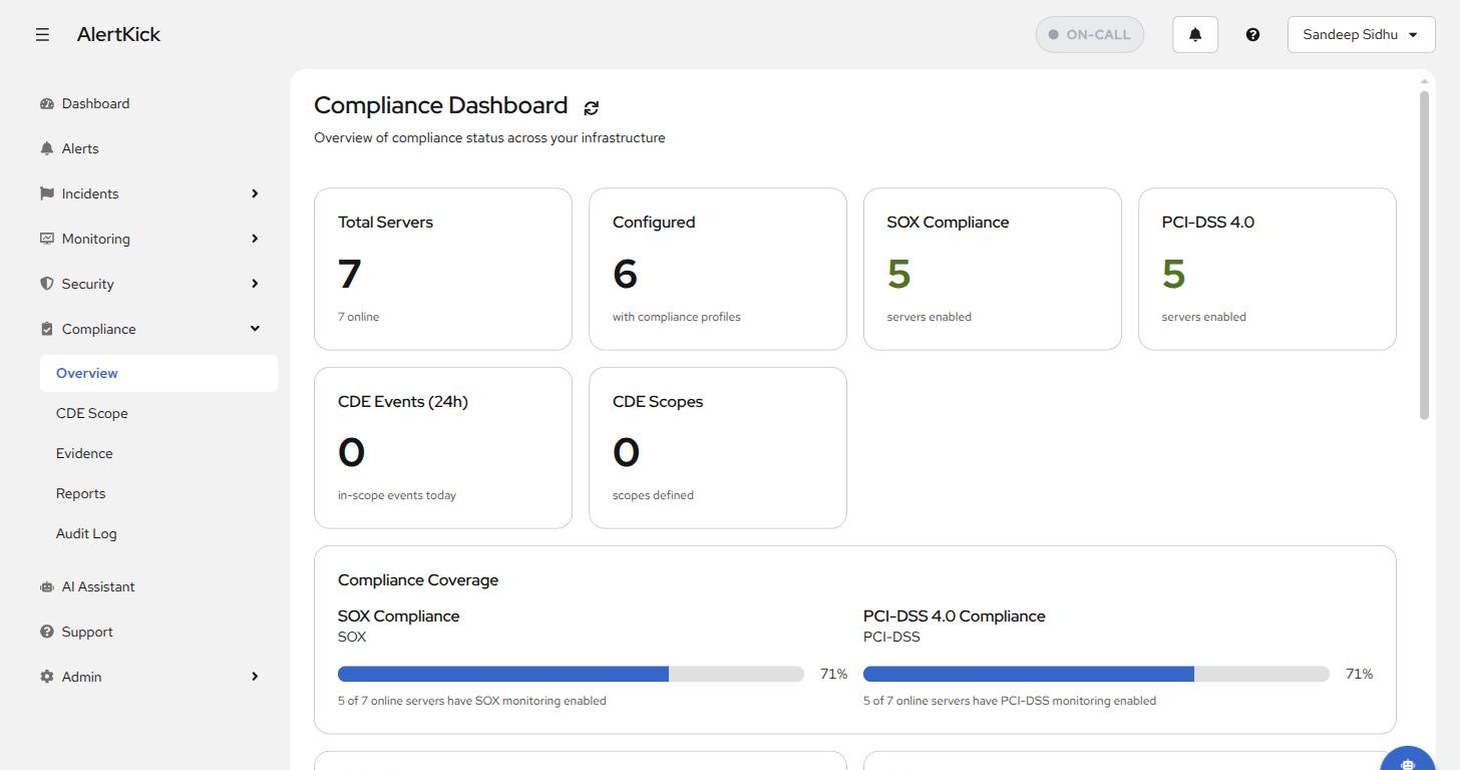
The CDE tiles relate to PCI-DSS scoping: Compliance -> CDE Scope lets you define cardholder data environment boundaries and push them to hosts. Events matching a boundary are tagged and prioritised for compliance, and the Evidence view can filter to a scope - so PCI questions stay focused on the systems that actually process card data instead of your whole fleet.
Browsing evidence
Compliance -> Evidence is the filtered view of the security event stream - only events whose rules carry a framework tag, with the framework shown per row:
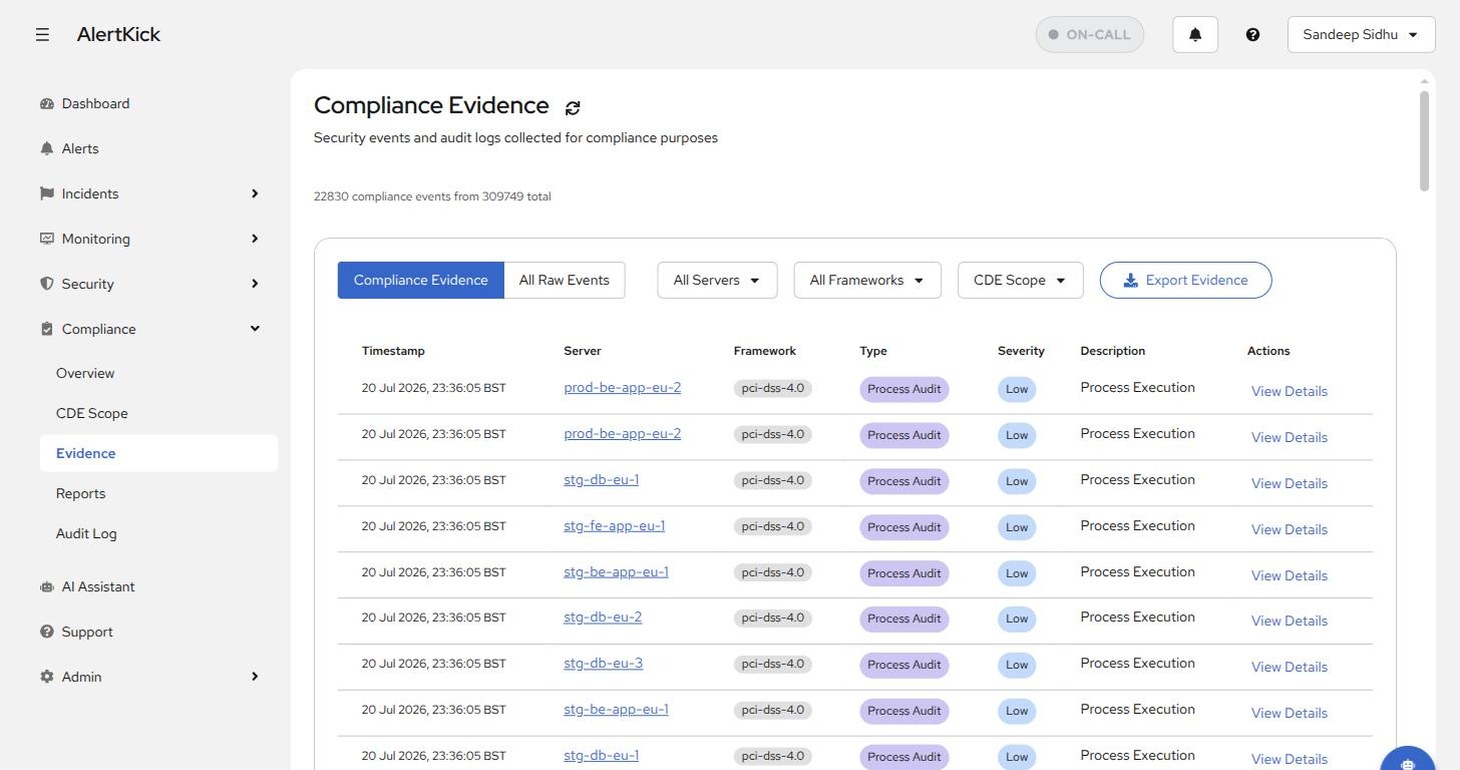
- The Compliance Evidence / All Raw Events toggle switches between the tagged subset and the full event stream - useful when you need to show an auditor the haystack the evidence came from.
- Filters narrow by server, framework, or CDE scope.
- Export Evidence downloads the current filtered view - the quick path when an auditor asks for “everything from that host in June” and a full report would be overkill.
- View Details on any row opens the underlying security event with its full context, so evidence is always traceable back to the raw kernel-level signal that produced it.
Generating a report
Compliance -> Reports is where evidence gets frozen into an artifact. Generate Report asks for the framework, an optional single server, and the date range:
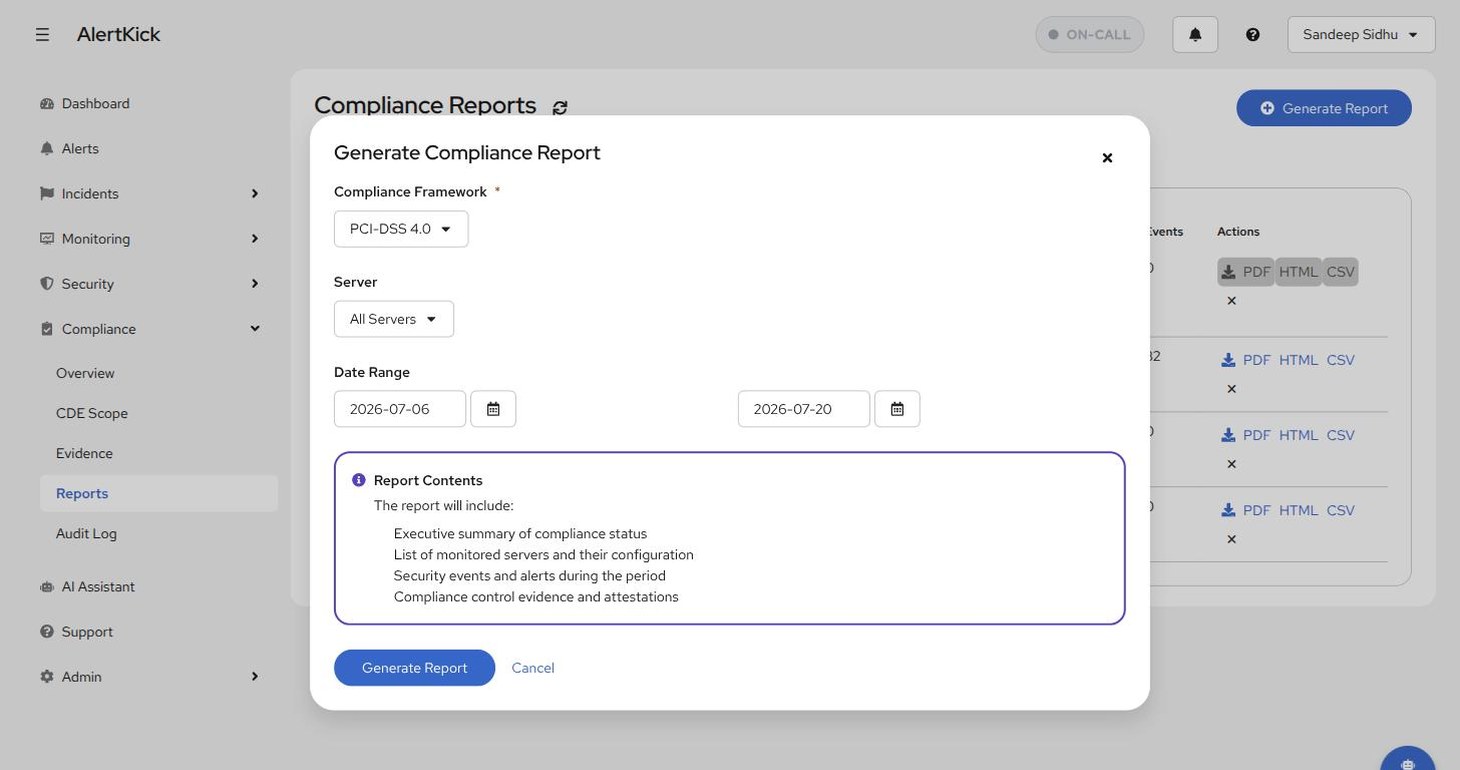
A report includes an executive summary of compliance status, the list of monitored servers and their configuration, security events and alerts during the period, and control-by-control evidence - the modal lists exactly what will be in it before you commit.
Generation runs in the background: the report appears in the list as Generating and flips to Completed when done (seconds for typical windows, longer for month-wide windows on busy tenants). A run that cannot finish shows as Failed with the reason in the status tooltip - generate again for the same window, nothing is consumed by a failed attempt. Each completed report downloads as PDF, HTML, or CSV:
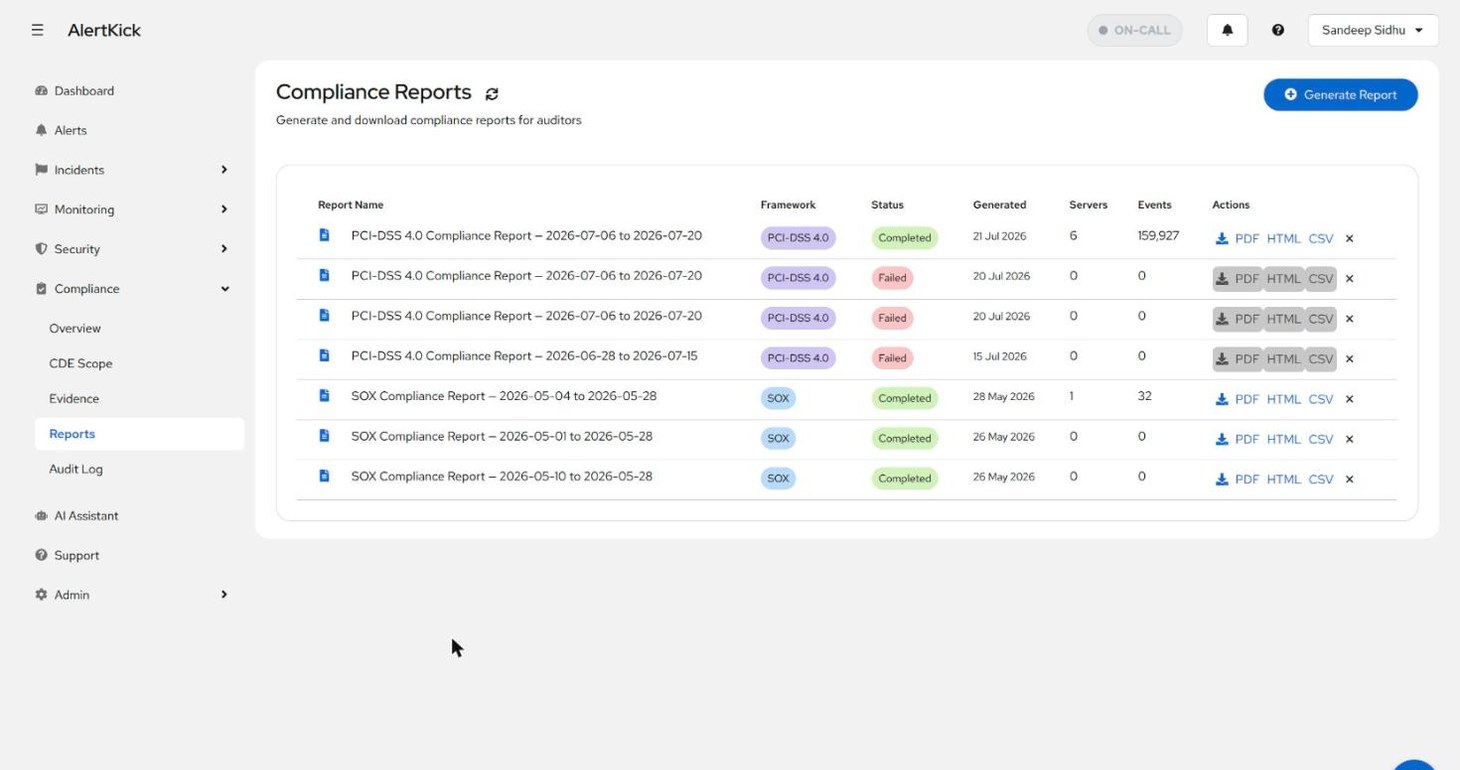
Reports are snapshots, deliberately: the counts and sampled events in a completed report never change afterwards, even as new events stream in - that is what makes them citable in an audit. Generate a new report for a new period rather than expecting an old one to update.
The audit log
Compliance -> Audit Log records every change to the compliance configuration itself - who created, pushed, or deleted a CDE scope, and when. Auditors ask “who can change the controls?” almost as often as they ask for event evidence, so the answer ships as part of the same section.
Next steps
- The evidence stream is the same one described in the security events guide - the framework tag is just one more dimension on it.
- See which detection rules map to which ATT&CK techniques in the MITRE ATT&CK overview.
Try it on your own infrastructure
Everything in this guide works on the free plan or the 30-day money-back paid tiers - uptime monitors, heartbeats, escalations and on-call, plus the agent for metrics and eBPF security. Setup takes minutes, not sprints.